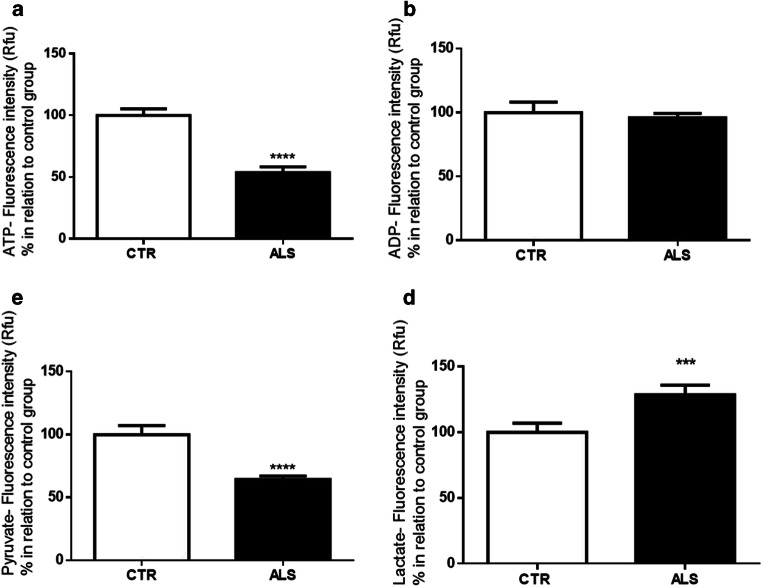
Fig. 5.
Changes in bioenergetics metabolic compounds (ATP, ADP, pyruvate, lactate) in PMBCs from ALS patients. a ATP, b ADP, c pyruvate, and d lactate levels. Data in graphs are the mean ± SD (N = 3, in duplicates), and the results were normalized as a percentage of the control group. Statistical analysis was performed using Student’s t test. It was considered significant when p < 0.05; ***p < 0.001 and ****p < 0.0001, in relation to CTR/control group

