
Figure 1. The workflow of Mtb-specific T cell repertoire and GLIPH2 analysis.
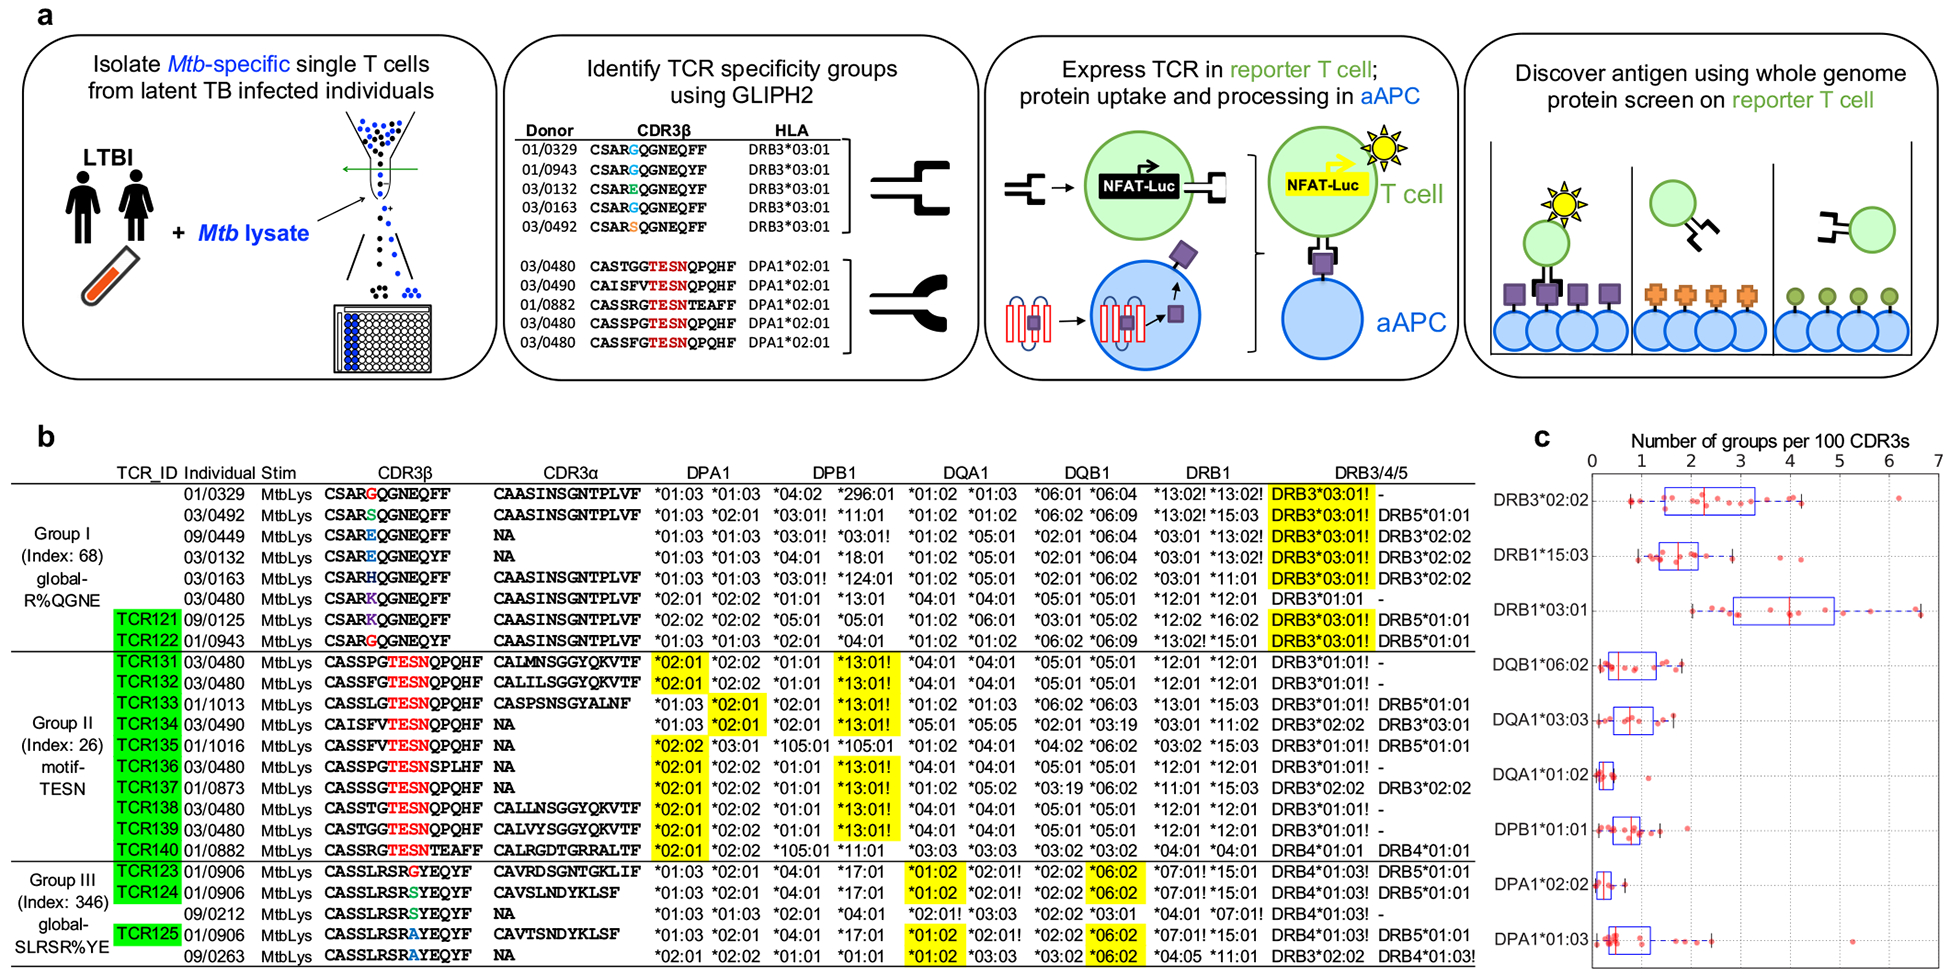
a, A schematic depicting the workflow. Briefly, PBMCs were isolated and stimulated with Mtb lysate for 12 hours. After stimulation, activated antigen-specific T cells were selected and single-cell sorted into 96-well plate for TCR sequencing. GLIPH2 analysis: TCRs with the same specificity contributed by different individuals sharing the same HLA allele were grouped together. Candidate TCRs were expressed in TCR-negative T cell line Jurkat 76; artificial antigen presenting cells (aAPC) were used to uptake protein antigen and present processed peptide. To identify antigens, reporter TCRs were screened against the whole proteome in microplate format. b, Representative TCR specificity groups and predicted HLA-restriction among Mtb-infected individuals (Group index from Supplementary Table 3). CDR3 α/β amino acid sequences from three GLIPH TCR specificity groups which only respond to Mtb lysate. Exclamation marks highlight the predicted common HLA class II alleles for each specificity group (combinatorial sampling probability Prob<0.1 DRB3*03 for group I, Prob<0.1 DPB1*13 for group II). Green colored boxes highlight the TCRs that have been validated in vitro. Yellow colored boxes indicate actual HLA as determined by reporter assay. c, The box plot shows the distribution of group numbers co-enriched with different HLA alleles among individuals (n=58). The y-axis indicates a specific HLA allele. The x-axis indicates the number of co-enriched specificity groups normalized to input CDR3 counts. Box-and-whisker plot shows 1 × interquartile ranges and 5–95th percentiles, centers indicate medians.