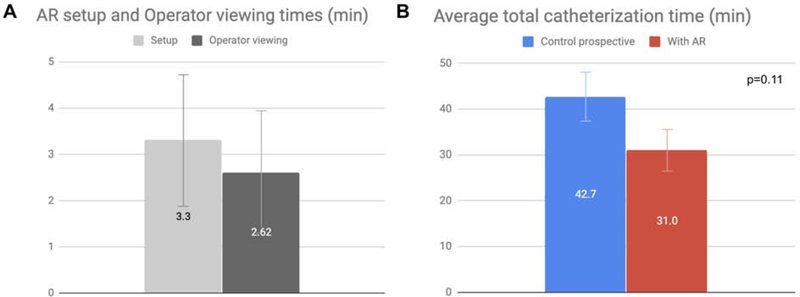
Figure 2.
Bar graphs of AR system setup and operator viewing times as well as total catheterization times for prospective TAEs performed with and without AR. A. Setup and operator viewing times were similar. Error bars represent standard deviation. B. 27% decrease in average total catheterization time (p=0.11). Error bars represent standard error from the mean.

