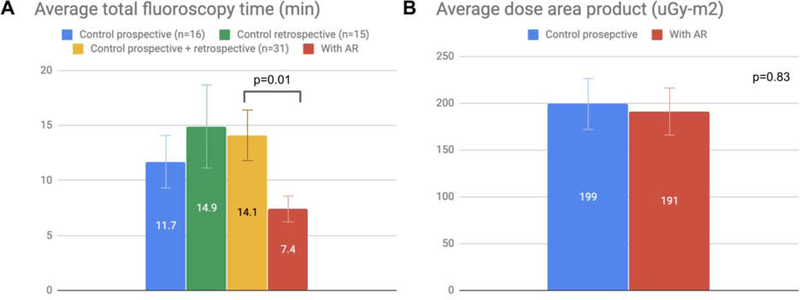
Figure 3.
Bar graphs of radiation exposure for TAEs performed with or without AR. Error bars represent standard error from the mean. A. 36% decrease in total fluoroscopy time with AR compared to prospective controls (p=0.12). No difference in fluoroscopy time between prospective and retrospective controls (p=0.48). 48% decrease in fluoroscopy time compared to combined prospective and retrospective controls (p=0.01). Variation narrowed following AR as seen in the error bars. B. No significant change in DAP was observed (p=0.83) despite decreased fluoroscopy time.

