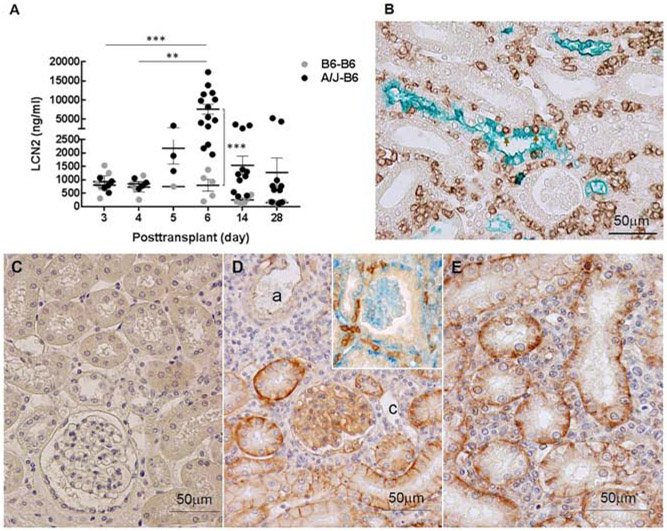
Figure 2. LCN2 expression following kidney transplantation.
(A) LCN2 was measured in urine samples from recipients with isografts (B6-B6) and allografts (A/J-B6) by ELISA. Each point represents an individual sample. Bars represent mean ± SEM. **P < 0.01, ***P < 0.001 by 2-way ANOVA with Sidak’s multiple comparisons test. (B) Representative double stain for LCN2 (green; Vina green) and CD8 T cells (brown; DAB) in allografts at posttransplant day 6. Arrows indicate CD8 cells infiltrating tubular epithelium. PD-L1 expression in iso- and allografts at day 6. No staining for PD-L1 in isografts (C) compared to strong staining on the basal aspects of tubular epithelium and glomerular capillary endothelium in allografts (D, E). Arterial (a) and peritubular capillary (c) endothelium is weakly positive or negative (brown; DAB). T cells (brown: DAB) in contact with PD-L1(blue; Vector Blue) on tubular epithelium (inset of D).

