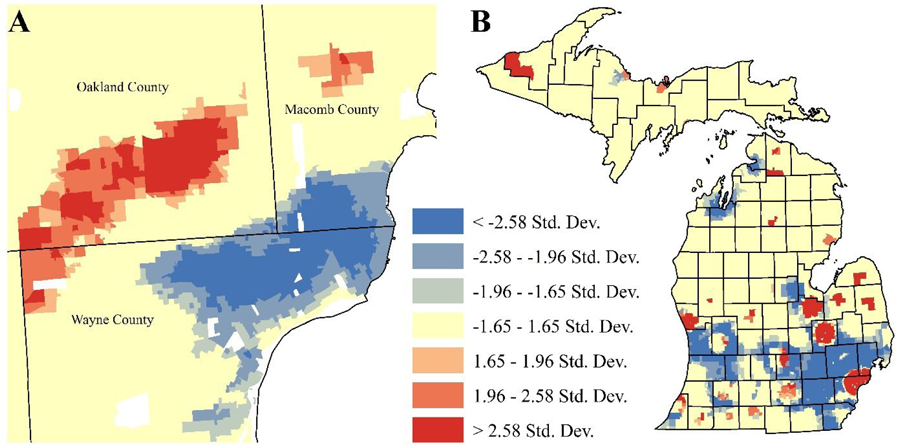
Figure 3.

Getis-Ord Gi* clustering analysis of A) ASD providers near Detroit, Michigan and B) Socioeconomic Distress in Michigan Overall. In map A, shades of red represent areas where ASD services are significantly more likely to be present, while shades of blue represent areas where ASD services are significantly more likely to be absent. In map B, shades of red represent areas where socioeconomic distress is significantly more likely to be high, while shades of blue represent areas where socioeconomic distress is significantly more likely to be low.
