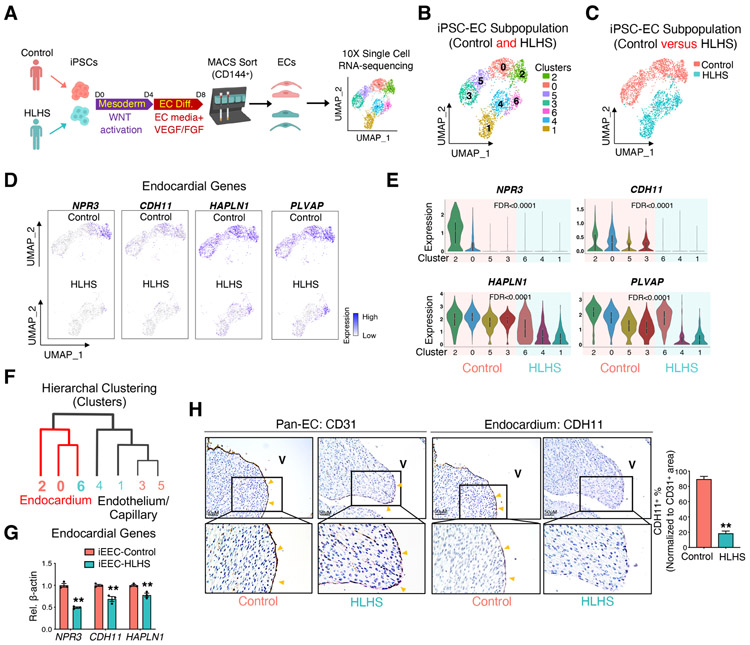
Figure 2. scRNA-seq of iPSC-ECs unraveled a developmentally impaired endocardial population in HLHS patients.
(A) Illustration of 10X Genomics scRNA-seq of iPSC-ECs from one healthy control and one HLHS patient. (B) UMAP projection of iPSC-ECs from both the control and HLHS patient. Each color defines one subpopulation based on the transcriptomic phenotype. (C) UMAP projection colored by cell origin. (D) UMAP plots of iPSC-ECs colored by expression levels of endocardial markers. Purple denotes high expression, white minimal expression. (E) Violin plot visualization of endocardial gene expression distribution across different subpopulations and normalized by cell number. False discover rate (FDR) indicated the significance of difference between control (cluster 2, 0, 5, and 3) vs HLHS (cluster 6, 4, and 1). (F) Hierarchal clustering analysis of EC clusters from scRNA-seq. Red lines: endocardial cluster branch. (G) Confirmation of endocardial genes expression changes between control (n=4) and HLHS (n=3) iEECs by quantitative PCR (qPCR). (H) Immunostaining of pan-EC (CD31) and endocardial (CDH11) proteins in fetal hearts from control (n=6) and HLHS (n=12) patients. In (G) and (H), data shown as the mean ± SEM. **p<0.01, control vs HLHS. See also Figure S2 and Table S1, S2, and S4.

