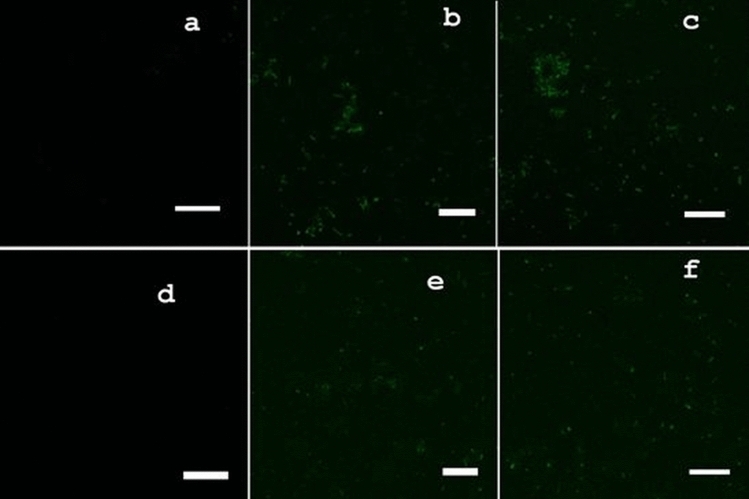
Figure 9.
Confocal microscopy of green fluorescence images of ROS in Cu2O NPs treated, and untreated control cells measured by 2,7-dichlorofluorescin diacetate (DCFH-DA) fluorescence-based assay. Cells were treated with 0, 62.5 and 125 μg/mL of surfactant stabilized Cu2O NPs for 24 h. (a–c) green fluorescence images of 0, 62.5 and 125 μg/mL dose Cu2O NPs exposed Gram-positive B. subtilis CN2 cells. (d–f) green fluorescence images of 0, 62.5 and 125 μg/mL dose Cu2O NPs exposed Gram-negative P. aeruginosa CB1 cells. Untreated cells were used as a negative control (a, d). Scale Bar: 5 µm.

