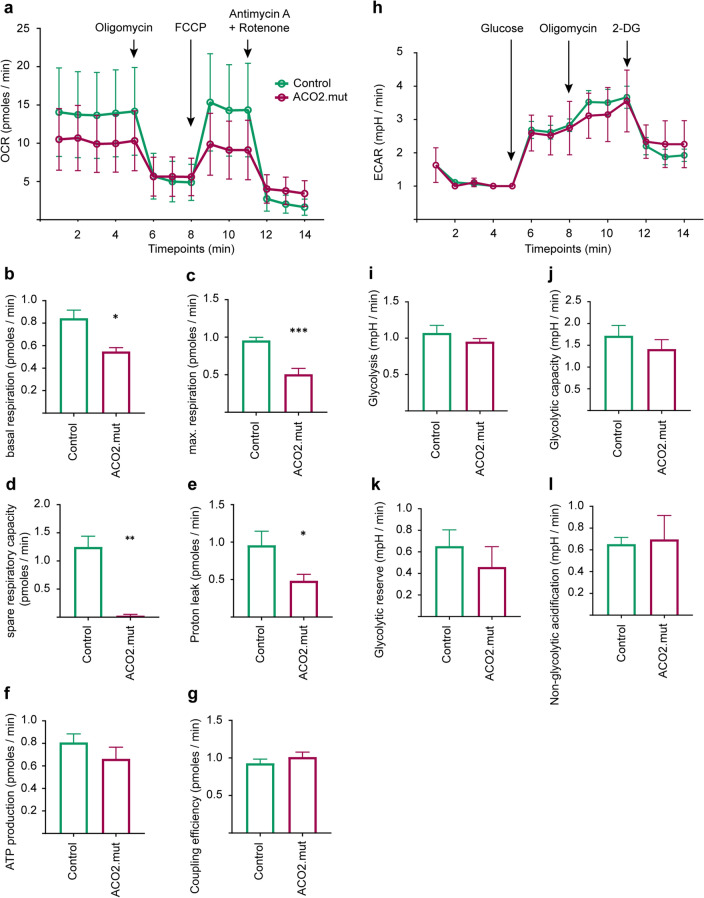
Figure 4.
ACO2-mutant fibroblasts display reduced mitochondrial respiratory function. (a) Overview of measurement of oxygen consumption rate (OCR) in whole fibroblasts sequentially treated with 1 µM Oligomycin, 250 nM FCCP and 5 µM Antimycin A + Rotenone. OCR data were normalized to the total protein concentration in each well after cell lysis. Data indicated as mean ± SEM, (n = 5). (b) Basal respiration, (c) maximal respiration, (d) spare respiratory capacity, (e) proton leak, (f) ATP production and (g) coupling efficiency calculated from OCR data shown in (a). Data indicated as mean ± SEM. Significance calculated by Mann–Whitney test, *p ≤ 0.05, **p ≤ 0.01, ***p ≤ 0.001, (n = 5). (h) Overview of measurement of the extra-cellular acidification rate (ECAR) in whole fibroblasts. During measurement, cells were sequentially treated with 1 mM Glucose, 10 µM Oligomycin and 10 mM 2-deoxyglucose (2-DG). ECAR data were normalized to the total protein concentration in each well after cell lysis. Data indicated as mean ± SEM, (n = 3). (i) Glycolysis rate, (j) Glycolytic capacity, (k) Glycolytic reserve and (l) non-glycolytic acidification were calculated from ECAR data shown in (h). Data indicated as mean ± SEM. * p ≤ 0.05, **p ≤ 0.01, ***p ≤ 0.001, Mann–Whitney test (n = 3).

