Figure 1.
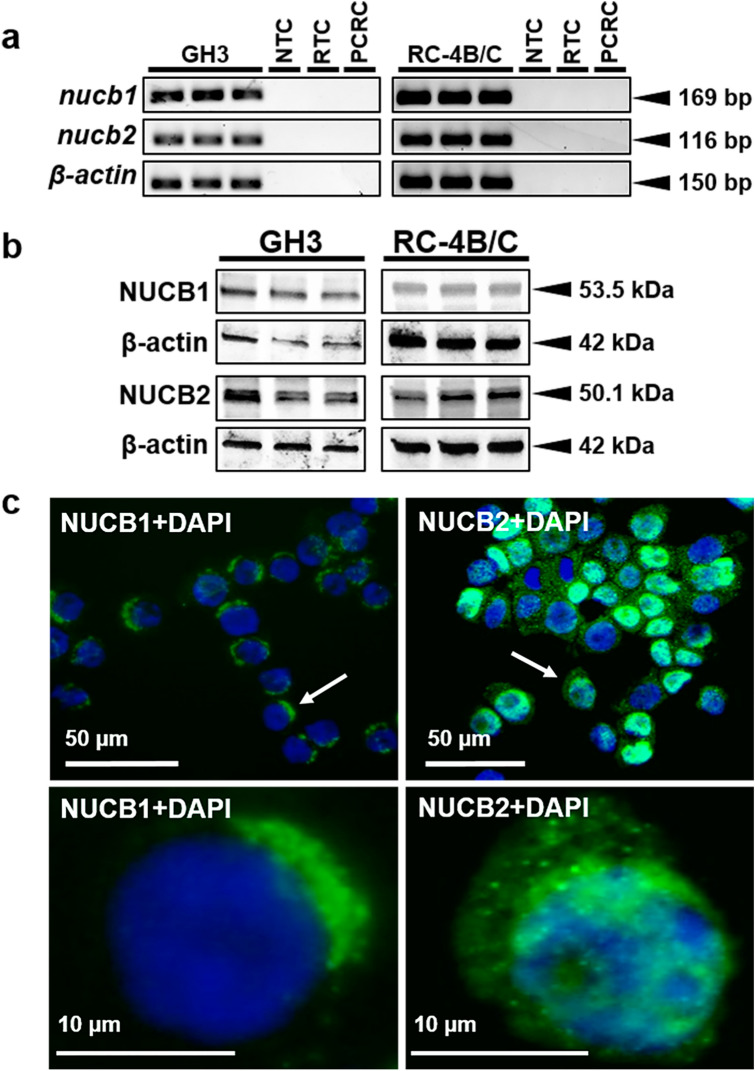
Mammalian somatotrophs express both NUCB1 and NUCB2. (a) Representative gel images showing nucb1, nucb2 and β-actin PCR products from both GH3 and RC-4B/C rat somatotroph cells. NTC: No Template Control. RTC: No Reverse Transcriptase Control. PCRC: PCR Control (No Template Control in the PCR). (b) Representative immunoreactive bands of NUCB1, NUCB2 and β-actin analyzed by Western blot in protein extracts from either GH3 or RC-4B/C rat somatotroph cells. (c) Representative images of NUCB1 and NUCB2 (in green) protein expression in GH3 cells counterstained with DAPI (in blue) and detected by immunofluorescence. The images below correspond to an amplification of the area indicated with an arrow in the corresponding image above. Images were acquired at 40X magnification.

