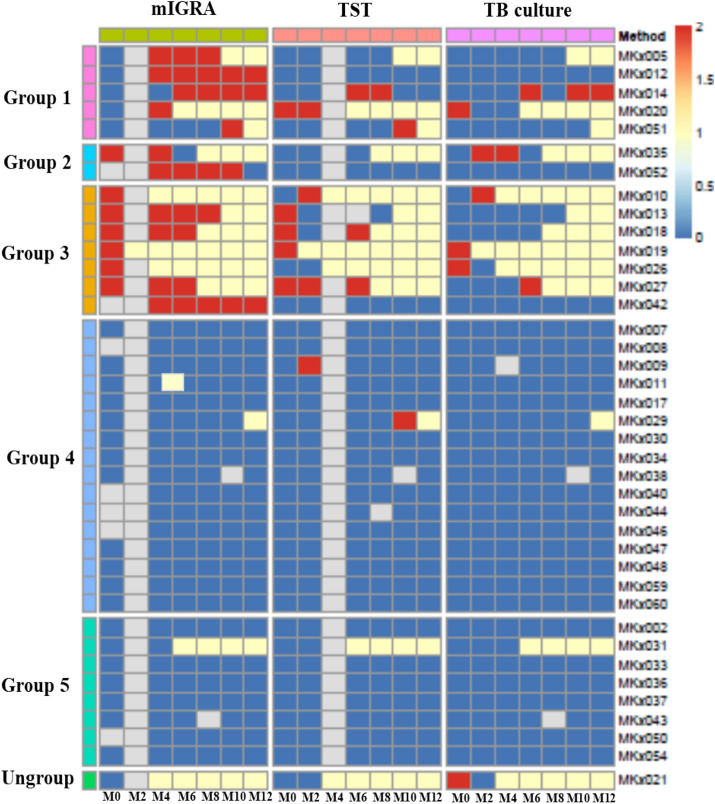
Figure 1.
Monkey groups among 39 cynomolgus monkeys. The monkeys were categorized on the basis of the results of the three TB diagnosis methods (mIGRA, TST, and TB culture) according to time (months, M). For M0, M2, M4, M6, M8, M10 and M12, a number means a record was present for that month. All results are presented as a heat map (please see Table S3 for more details). Positive-mIGRA, positive-TST, suspected-TST and positive-TB culture are scored as 2 (red), while indeterminate-mIGRA, negative-mIGRA, negative-TST and negative-TB culture are scored as 0 (blue). The heat map was created by Rstudio Version 1.3.1073 at https://www.rstudio.com (pheatmap package).

