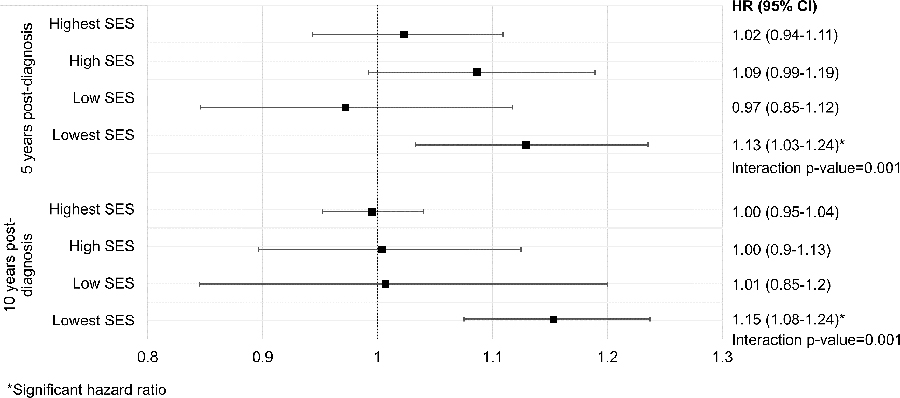
Figure 1. Effect modification by census-tract socioeconomic status of the association of fine particulate matter (PM2.5) and cancer mortality among AYA cancer patients.

A forest plot for the effect modification by census tract socioeconomic status (SES) of the association of PM2.5 and cancer mortality among AYA patients is shown. Cancer mortality was measured at 5- and 10-years after diagnosis. The black squares denote the SES quartile-specific hazard ratios and the capped horizontal bars indicate the bounds of the 95% confidence intervals. The p-value for the interaction term of SES and PM2.5 in the main model is written underneath the hazard ratio for the lowest SES quartile. The p-values for the interaction term in the 5-and 10-year models are shown.
