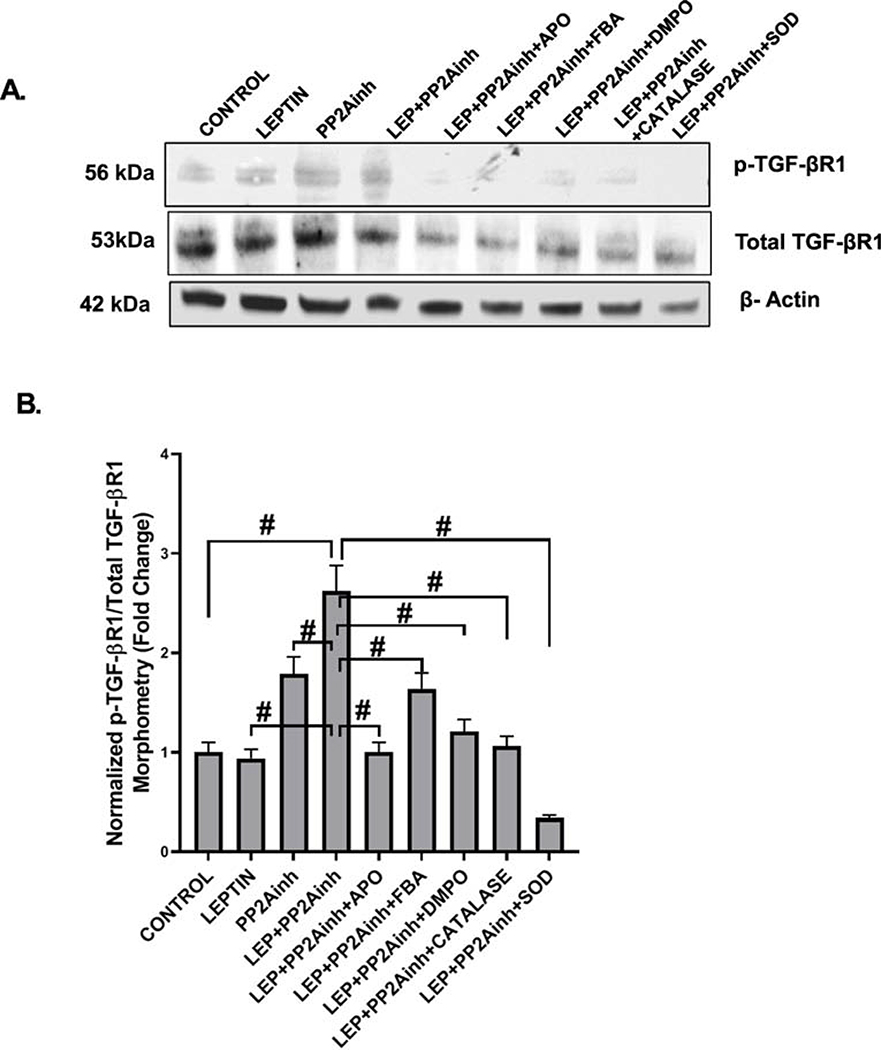
Fig. 10.
(A) Western blot analysis of phospho-TGF-βR1 and total TGF-βR1 protein levels in the mouse primary intestinal epithelial cell lysates. Lanes 1–9 represent Control, LEP, PP2Ainh, (LEP+PP2Ainh), (LEP+PP2Ainh+APO), (LEP+PP2Ainh+FBA), (LEP+PP2Ainh+DMPO), (LEP+PP2Ainh+CATALASE), and (LEP+PP2Ainh+SOD) groups of cells respectively. (B) Band quantification of phospho-TGF-βR1 immunoblot normalized against total TGF-βR1 in the above-mentioned groups of mouse primary intestinal epithelial cells (#p< 0.01). Significance was tested by performing unpaired t-test between the groups (*p< 0.05, 0.05<**p < 0.01, #p< 0.01), followed by Bonferroni Dunn Post hoc corrections. Results were expressed as mean ± SEM.

