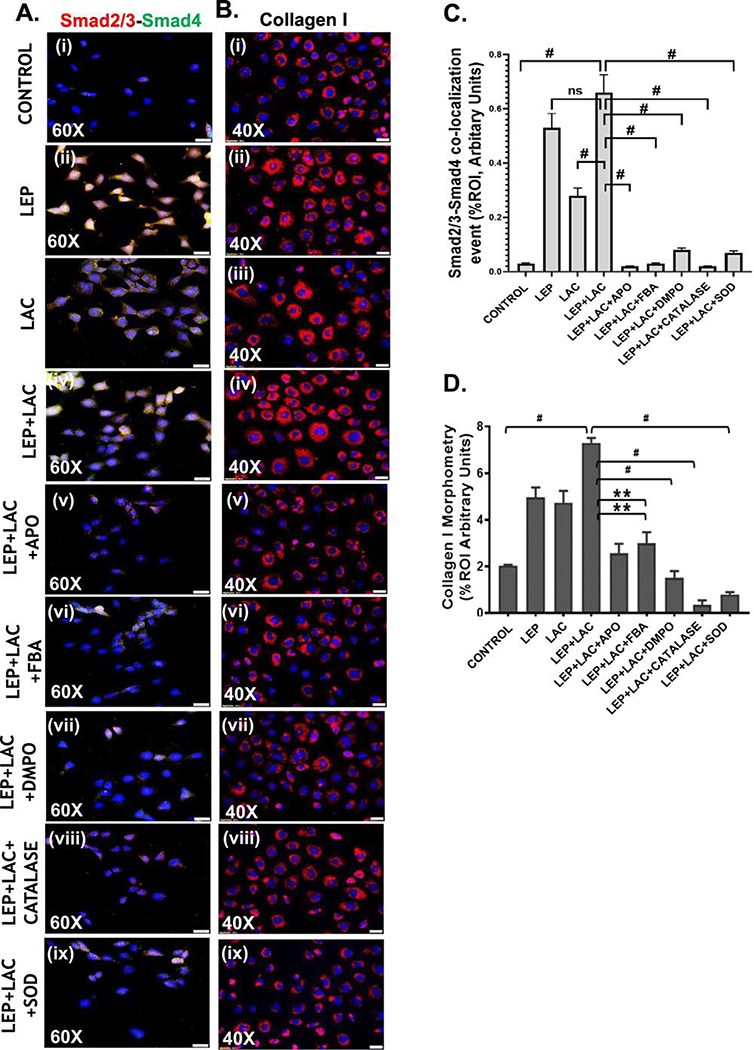
Fig. 8.
(A)(i-ix) Immunofluorescence images depicting Smad2/3 (red) and Smad4 (green) co-localization (in yellow) events, counterstained with DAPI (blue) in Control, LEP, LAC, (LEP+LAC), (LEP+LAC+APO), (LEP+LAC+FBA), (LEP+LAC+DMPO), (LEP+LAC+Catalase), and (LEP+LAC+SOD) groups of cells. Images were taken at 60X magnification. (B) (i-ix) Immunofluorescence images depicting collagen I immunoreactivity (in red), counterstained with DAPI (blue) in Control, LEP, LAC, (LEP+LAC), (LEP+LAC+APO), (LEP+LAC+FBA), (LEP+LAC+DMPO), (LEP+LAC+CATALASE), and (LEP+LAC+SOD) groups of cells. Images were taken in 40X magnification. (C) Morphometric analysis of Smad2/3-Smad4 co-localization events. Y-axis shows % positive immunoreactive area (% ROI) (n=5, analysis from five separate microscopic fields) (#p< 0.01, ns: non-significant). (D) Morphometric analysis of collagen I immunoreactivity, Y-axis shows % positive immunoreactive area (% ROI) (n=5, analysis from five separate microscopic fields) (0.05<**p < 0.01, #p< 0.01). Significance was tested by performing unpaired t-test between the groups (*p< 0.05, 0.05<**p < 0.01, #p< 0.01), followed by Bonferroni Dunn Post hoc corrections. Results were expressed as mean ± SEM.

