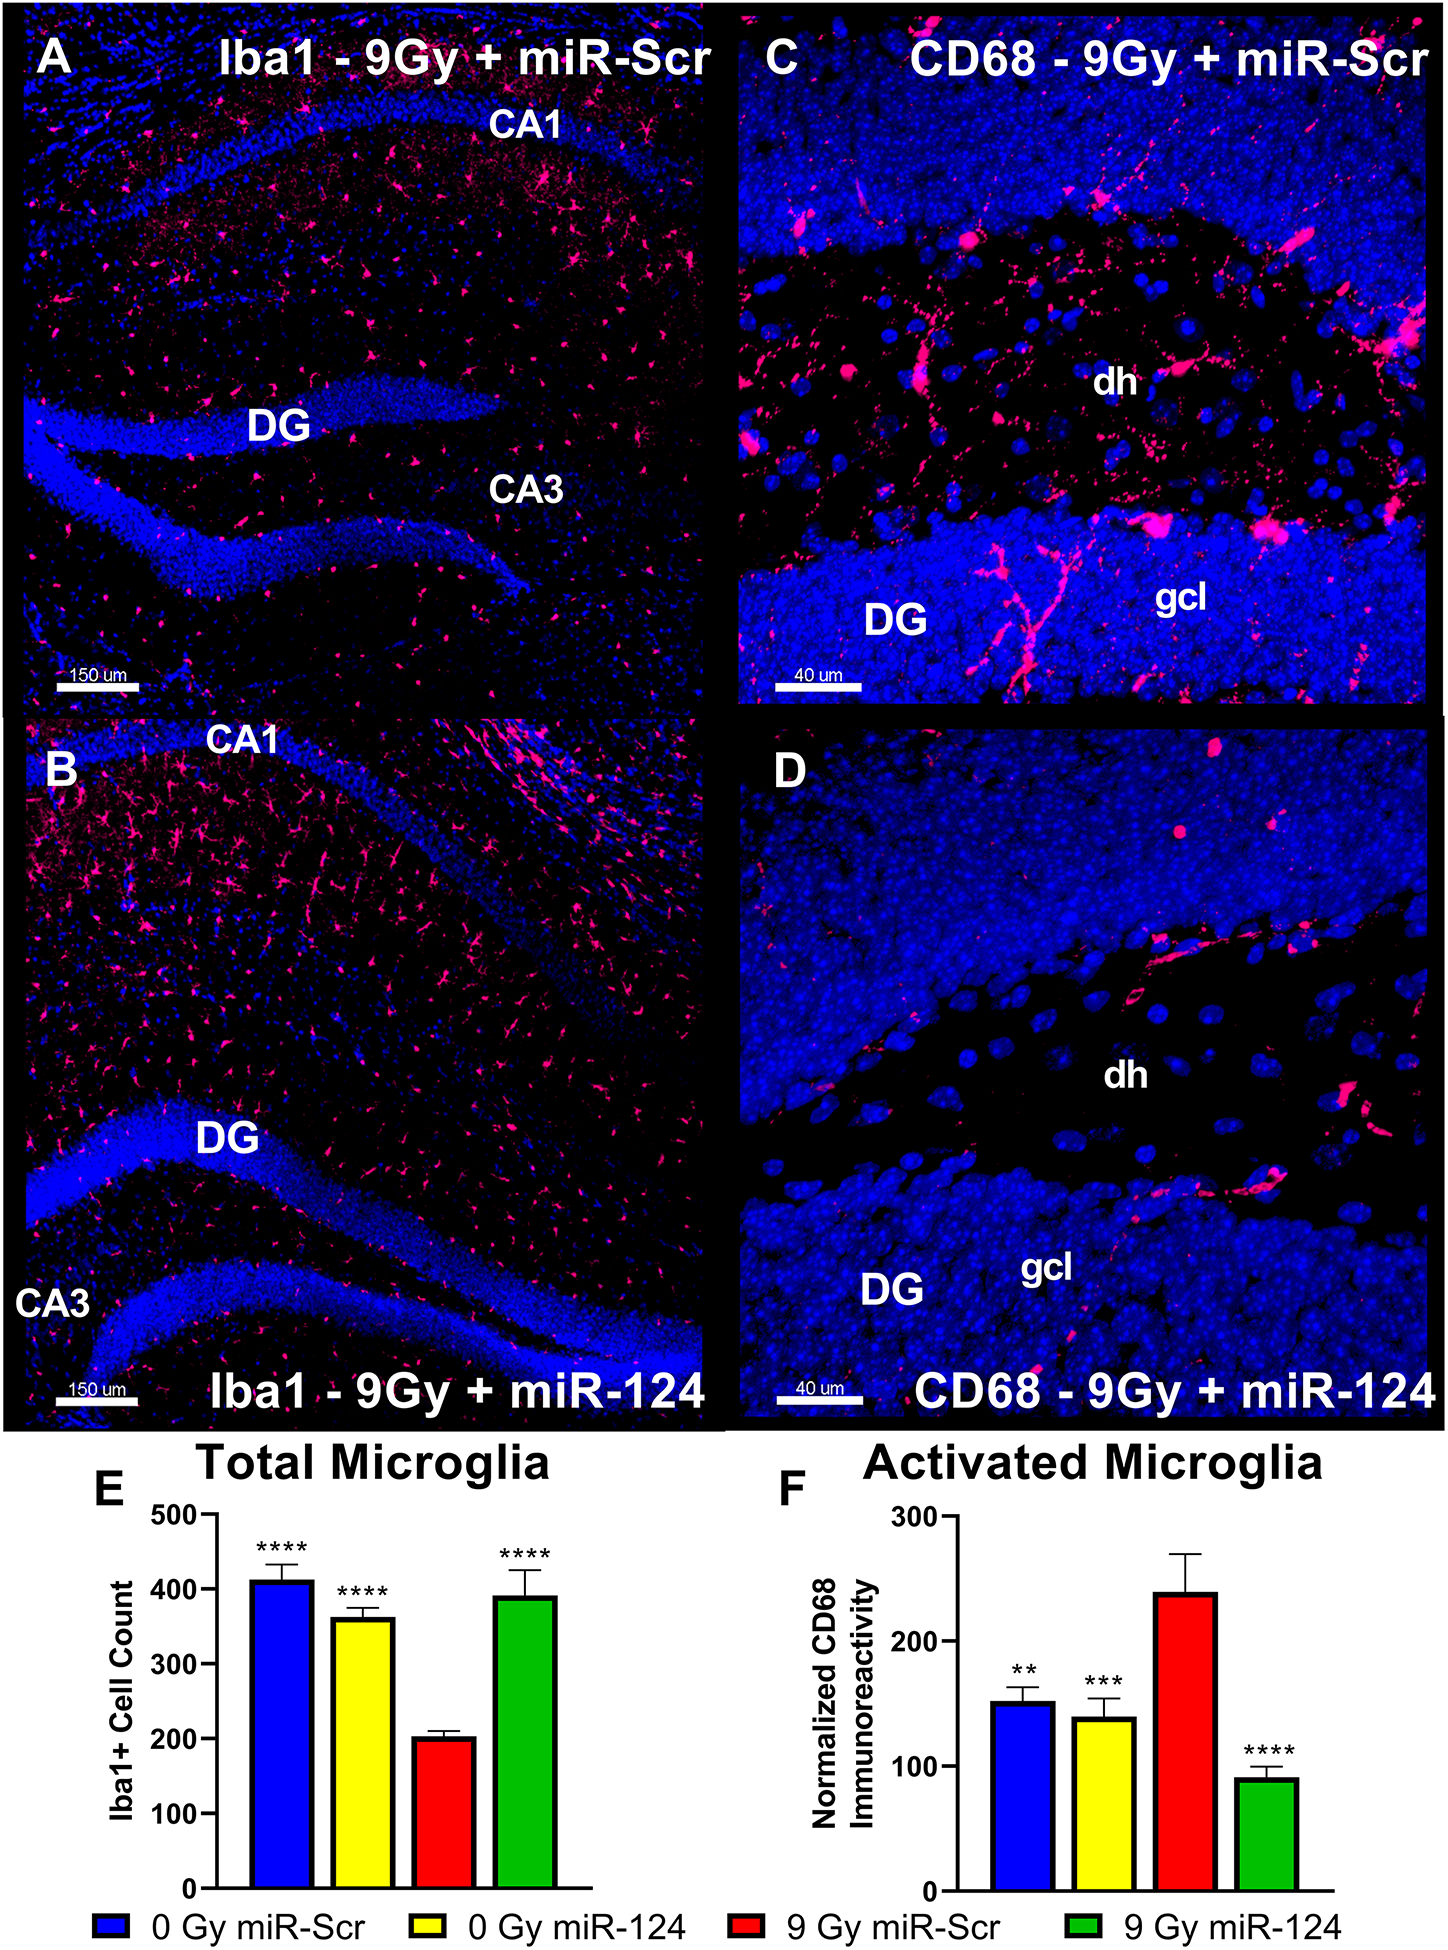
Figure 7. miR-124 overexpression in vivo following cranial irradiation reduces neuroinflammation in the hippocampus.

Representative images of Iba1+ microglia and CD68+ activated microglia immunohistochemistry are shown from the hippocampus and dentate gyrus (DG), respectively, for the 9 Gy miR-Scr and the 9 Gy miR-124 groups of the miR-124 cohort. Relative to miR-124-overexpressing group (B), the mice in the 9 Gy miR-Scr group show decreased numbers of Iba1+ cells in hippocampal subfields (A). miR-124 overexpression (D) resulted in a relative decrease in the CD68+ immunoreactivity in the DG region when compared to the 9 Gy miR-Scr group (C). Aggregate data from image processing with Imaris shows an increased Iba1-adjusted (E) volume of CD68 immunoreactivity in the irradiated group compared to the control and miR-124 overexpressing groups in the hippocampus (F). All data are presented as mean ± SEM (N = 4 mice per group). ** P < 0.01, *** P < 0.001 **** P < 0.0001 compared to the IRR group; P values are derived from ANOVA and Dunnett’s multiple comparisons test. Iba1, red; CD68, red; DAPI nuclear counterstain, blue. Scale bars = 150 μm (A, B) and 40 μm (C, D). dh, dentate hilus; gcl, granule cell layer.
