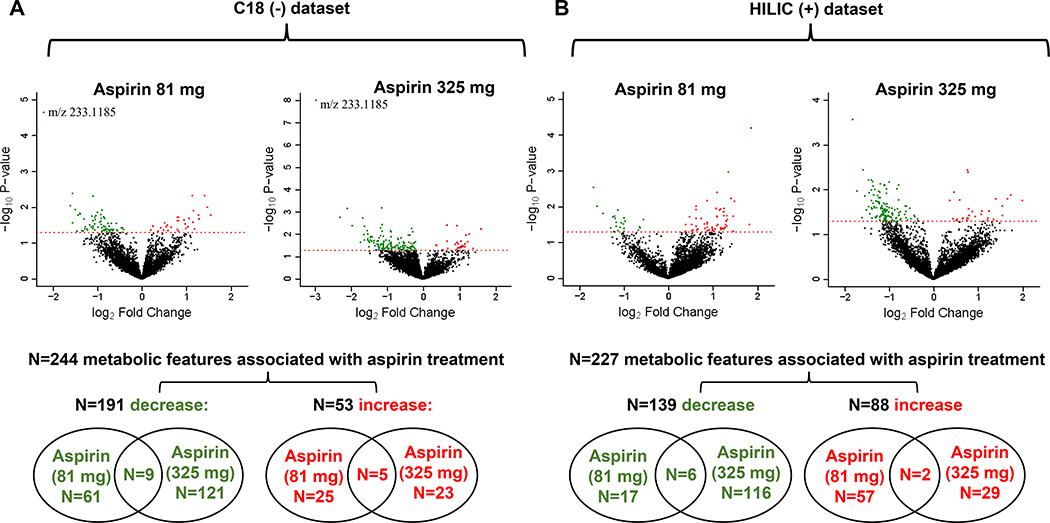
Figure 2.
Colon tissue metabolic features associated with aspirin treatment. A, C18 (–) dataset. B, HILIC (+) dataset. Linear regression was used to estimate the change in year 3 ion intensities in the aspirin treated group compared to the placebo group, adjusting for age, sex, race, and folate treatment. Volcano plots depict for each metabolic feature the magnitude of the change on the x-axis (log2fold change with aspirin treatment vs. placebo) and the statistical significance on the y-axis (-log10p-value for the association with aspirin treatment). Color-coded metabolic features statistically significantly increased (red) or decreased (green) with aspirin treatment (P<0.05). One feature significant at a false discovery rate (q<0.2) is indicated in the C18 volcano plots as m/z 233.1185. Venn diagrams indicate overlap of significant metabolic features across the two aspirin treatment groups (81 or 325 mg) for those that either decrease or increase with treatment.

