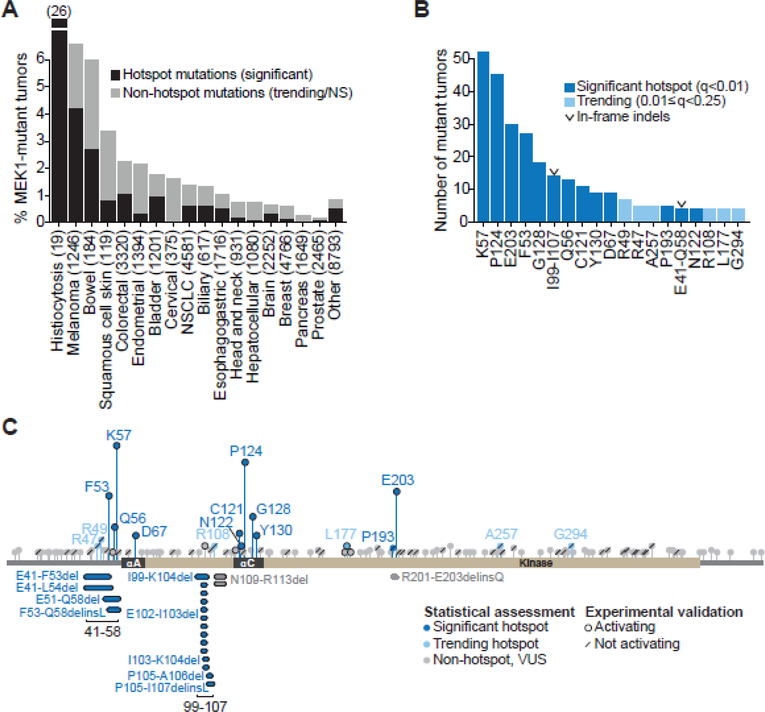
Figure 1. Landscape of MAP2K1 (MEK1) alterations in human cancer.
A, Percentage of tumors with somatic MAP2K1 mutations as a function of cancer type in a cohort of 42,434 sequenced tumor/normal pairs. Mutations were classified as significant hotspots (black) versus trending or not-significant (NS) non-hotspots (gray). B, Number of tumor samples per indicated significant hotspot (dark blue) or trending hotspot site (light blue). Two significant clusters of in-frame deletions are labeled with a “v” symbol. C, MEK1 protein schematic depicting the amino acid position, domain location, and recurrence of the 458 MEK1 mutants. Missense mutants were plotted above, and in-frame deletions were plotted below the domain schematic. Mutants were categorized as significant hotspots (q<0.01, dark blue), trending hotspots (0.01≤q<0.25, light blue) or non-hotspots (q>0.25, gray). Variants shown in subsequent functional studies to increase p-ERK expression are highlighted with a black ring, whereas those that had no effect on p-ERK are noted with a forward slash.

