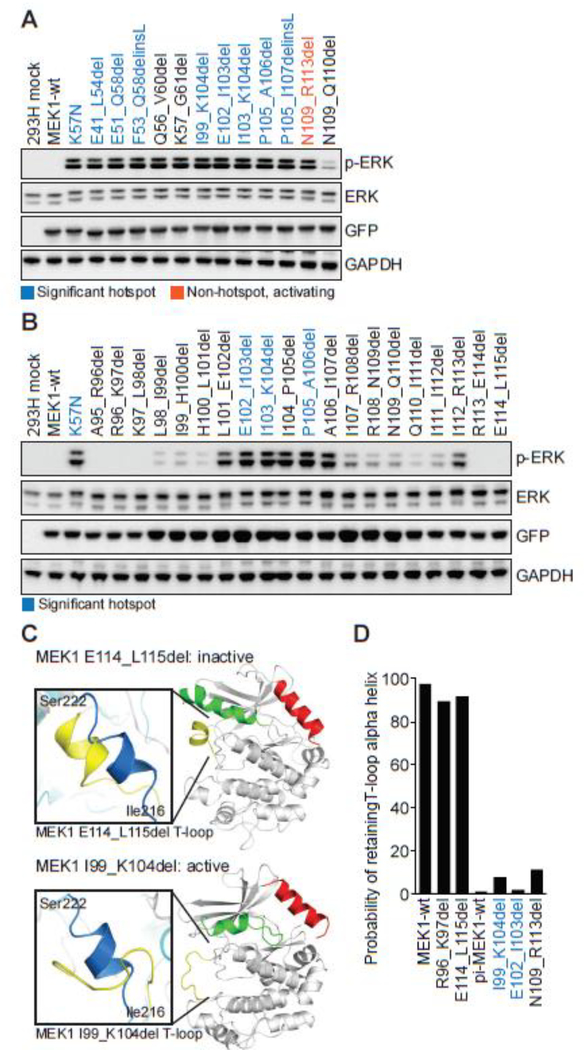
Figure 3. Functional and molecular dynamics characterization of two clusters of in-frame MEK1 deletions involving the negative regulatory domain and helix C.
A, MEK1 in-frame deletions were expressed in 293H cells and p-ERK expression compared to the K57N mutant. Expression of total ERK, GFP (MEK1) and GAPDH were assessed as controls. Mutations identified in patient tumors from our 42K cohort were color coded as statistically significant hotspots (dark blue), novel non-hotspot activating indels (orange), or other MEK1 in-frame deletions reported in the literature or used for comparison (black). B, Step-wise, two-base pair deletion mutants of MEK1 from A96 to K115 were expressed in 293H cells and p-ERK expression was assessed by western blot. C-D, The conformational changes and probability of retaining the wildtype T-loop alpha helix structure following molecular dynamics simulation for MEK1 in-frame deletion mutants, as in Figs. 2C–D.

