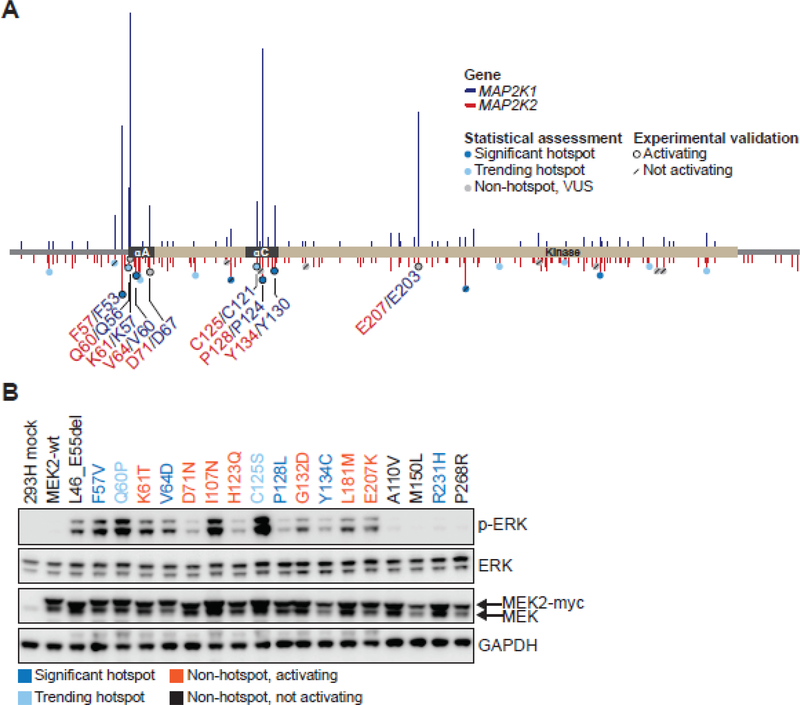
Figure 4. MEK2 residues paralogous to MEK1 hotspots are activating.
A, MEK2 protein schematic depicting the amino acid position, domain location, and recurrence of MEK2 mutants (below x axis, red) aligned with paralogous MEK1 mutants (above x axis, blue). MEK2 mutants were categorized as significant hotspots (q<0.01, dark blue), trending hotspots (0.01≤q<0.25, light blue) or non-hotspots (q>0.25, gray). Experimentally validated calls were outlined with a black ring indicating a mutation that induced p-ERK expression, or a forward slash signifying variants that had no effect on p-ERK expression. Functional MEK2 mutants identified in patient tumors within our 42K cohort are noted in red lettering, along with their paralogous MEK1 residues in navy blue. B, myc-tagged MEK2 mutants were generated, overexpressed in 293H cells and induction of ERK phosphorylation (p-ERK) was assessed by western blot. Expression of total ERK, MEK and GAPDH were assessed as controls. Hotspot MEK2 mutants (dark blue), trending hotspots (light blue), non-hotspot activating (orange), and non-hotspot, not activating (black) mutants are indicated.

