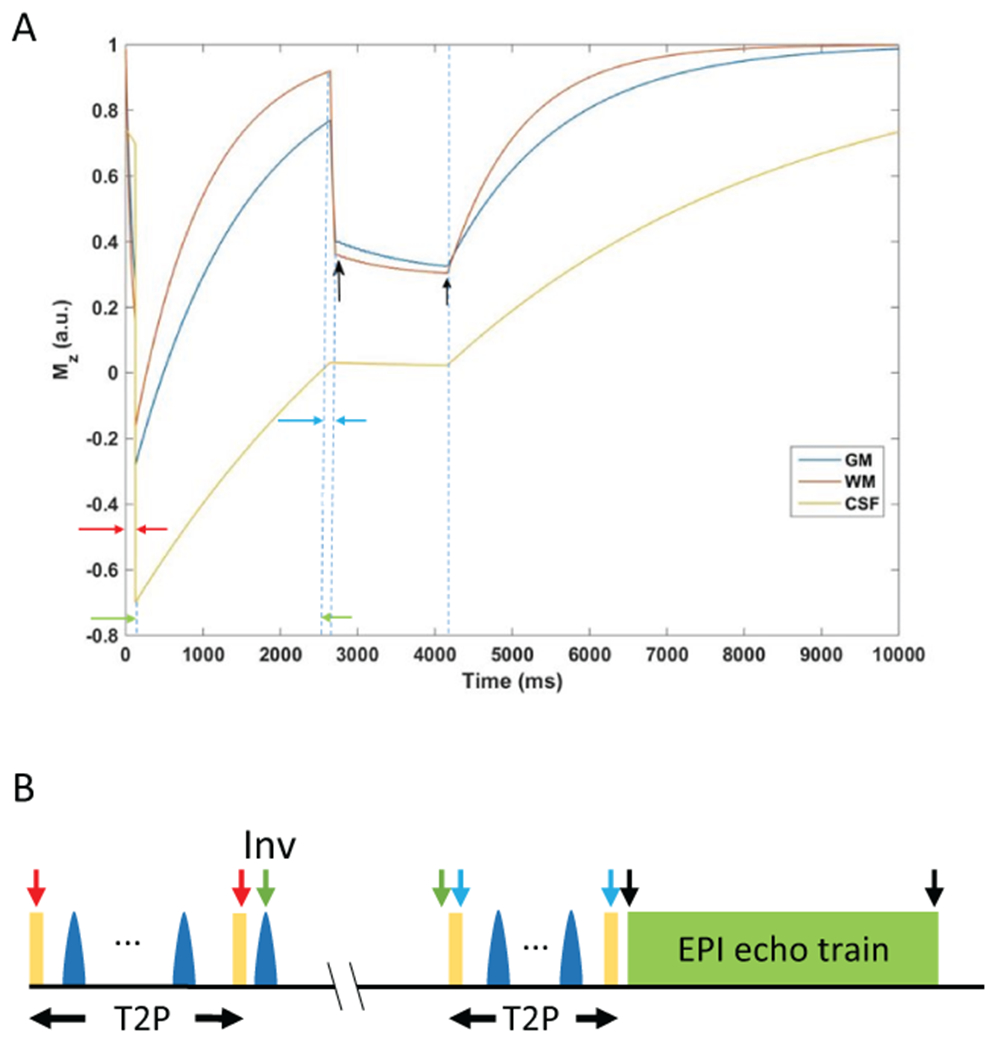
Figure 1.

Development of the inversion recovery susceptibility weighted imaging with enhanced T2 weighting (IR-SWIET) sequence. A) Mz evolution for IR-SWIET at steady-state. Arrows indicate beginning and end of each epoch. Black arrows indicate beginning and end of data acquisition. GM = gray matter, WM = white matter, CSF = cerebrospinal fluid. B) Schematic diagram for the IR-SWIET sequence. Arrows shown correspond to the magnetization epoch portrayed in (A).
