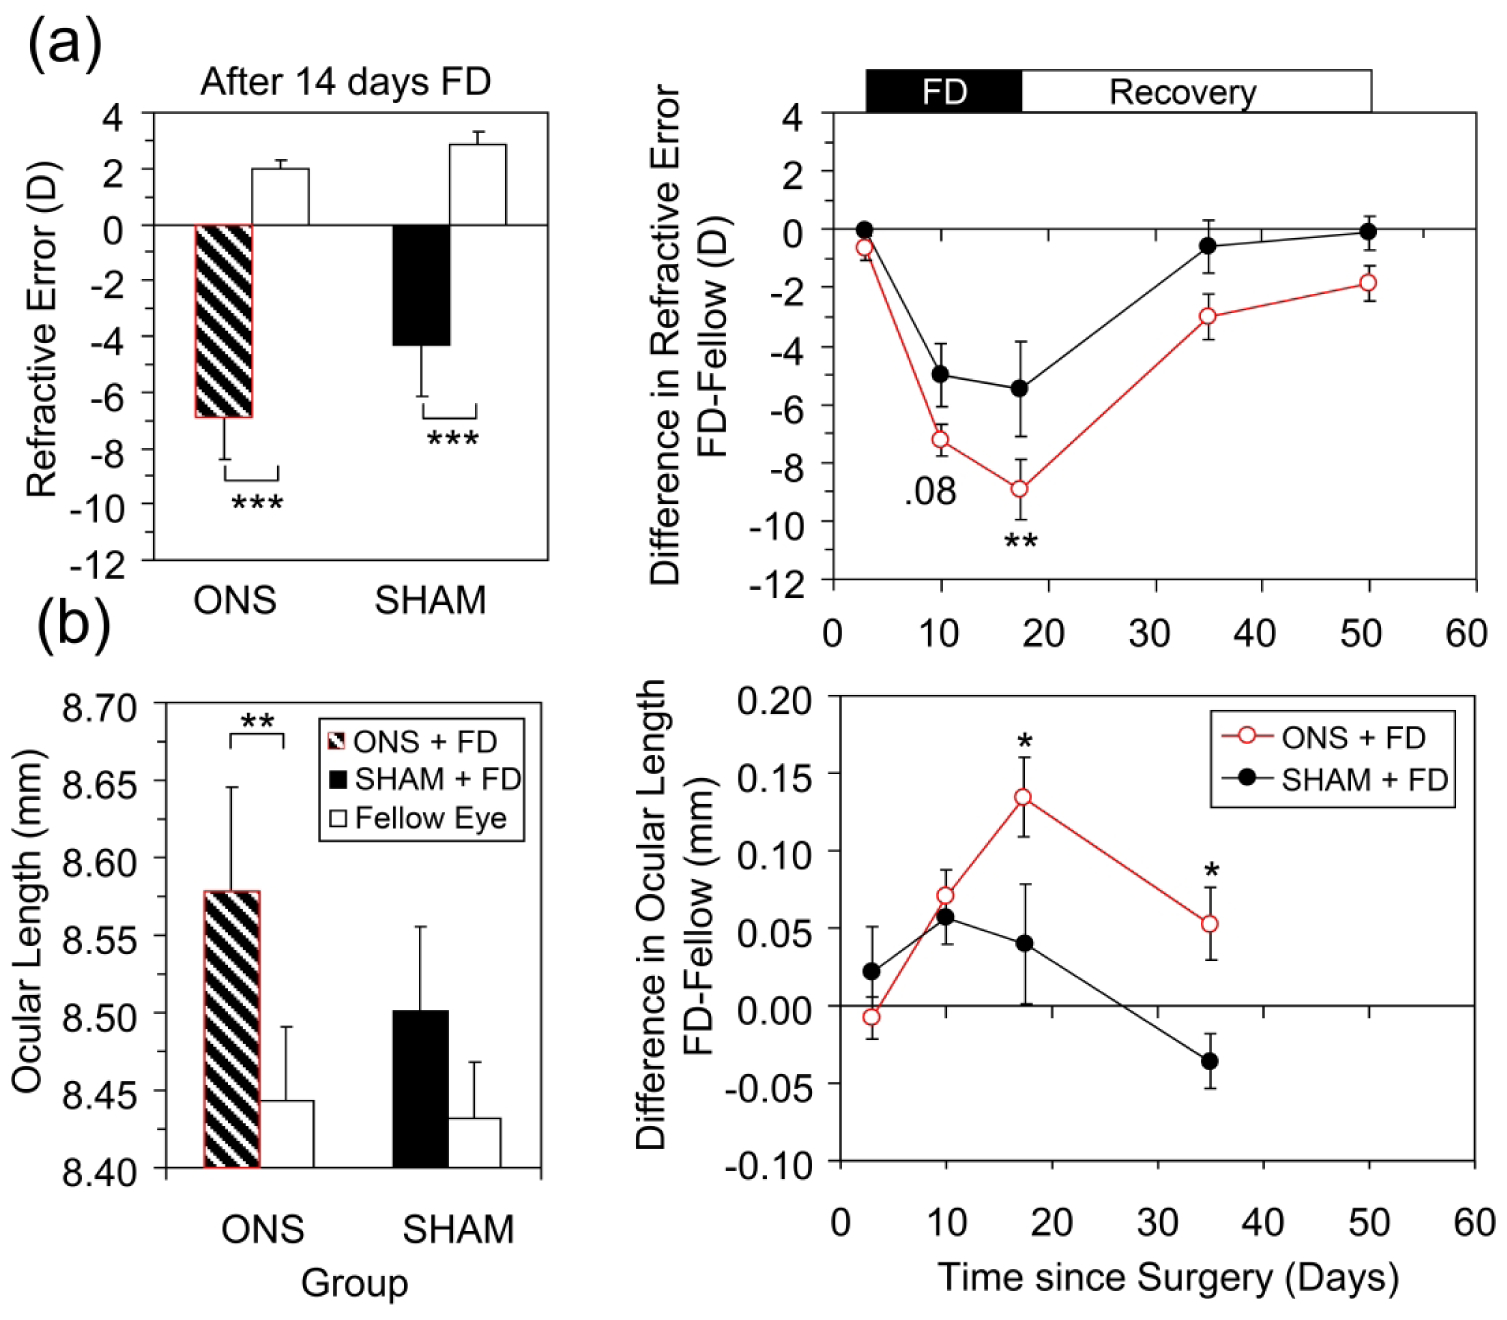
FIGURE 2.

Effects of monocular ONS compared with sham surgery (SHAM) on response to FD treatment; (a) Refractive error and (b) Ocular length. The left panels show mean data for treated and fellow eyes after 14 days of FD. The right panels show mean interocular differences before, during (Black bar at top) and after termination of FD treatment (White bar at top). P values are from Matched pairs t-tests (left panels) or Holm Sidak Comparisons (right panels): *, p < 0.05; **, p < 0.01; ***, p < 0.001.
