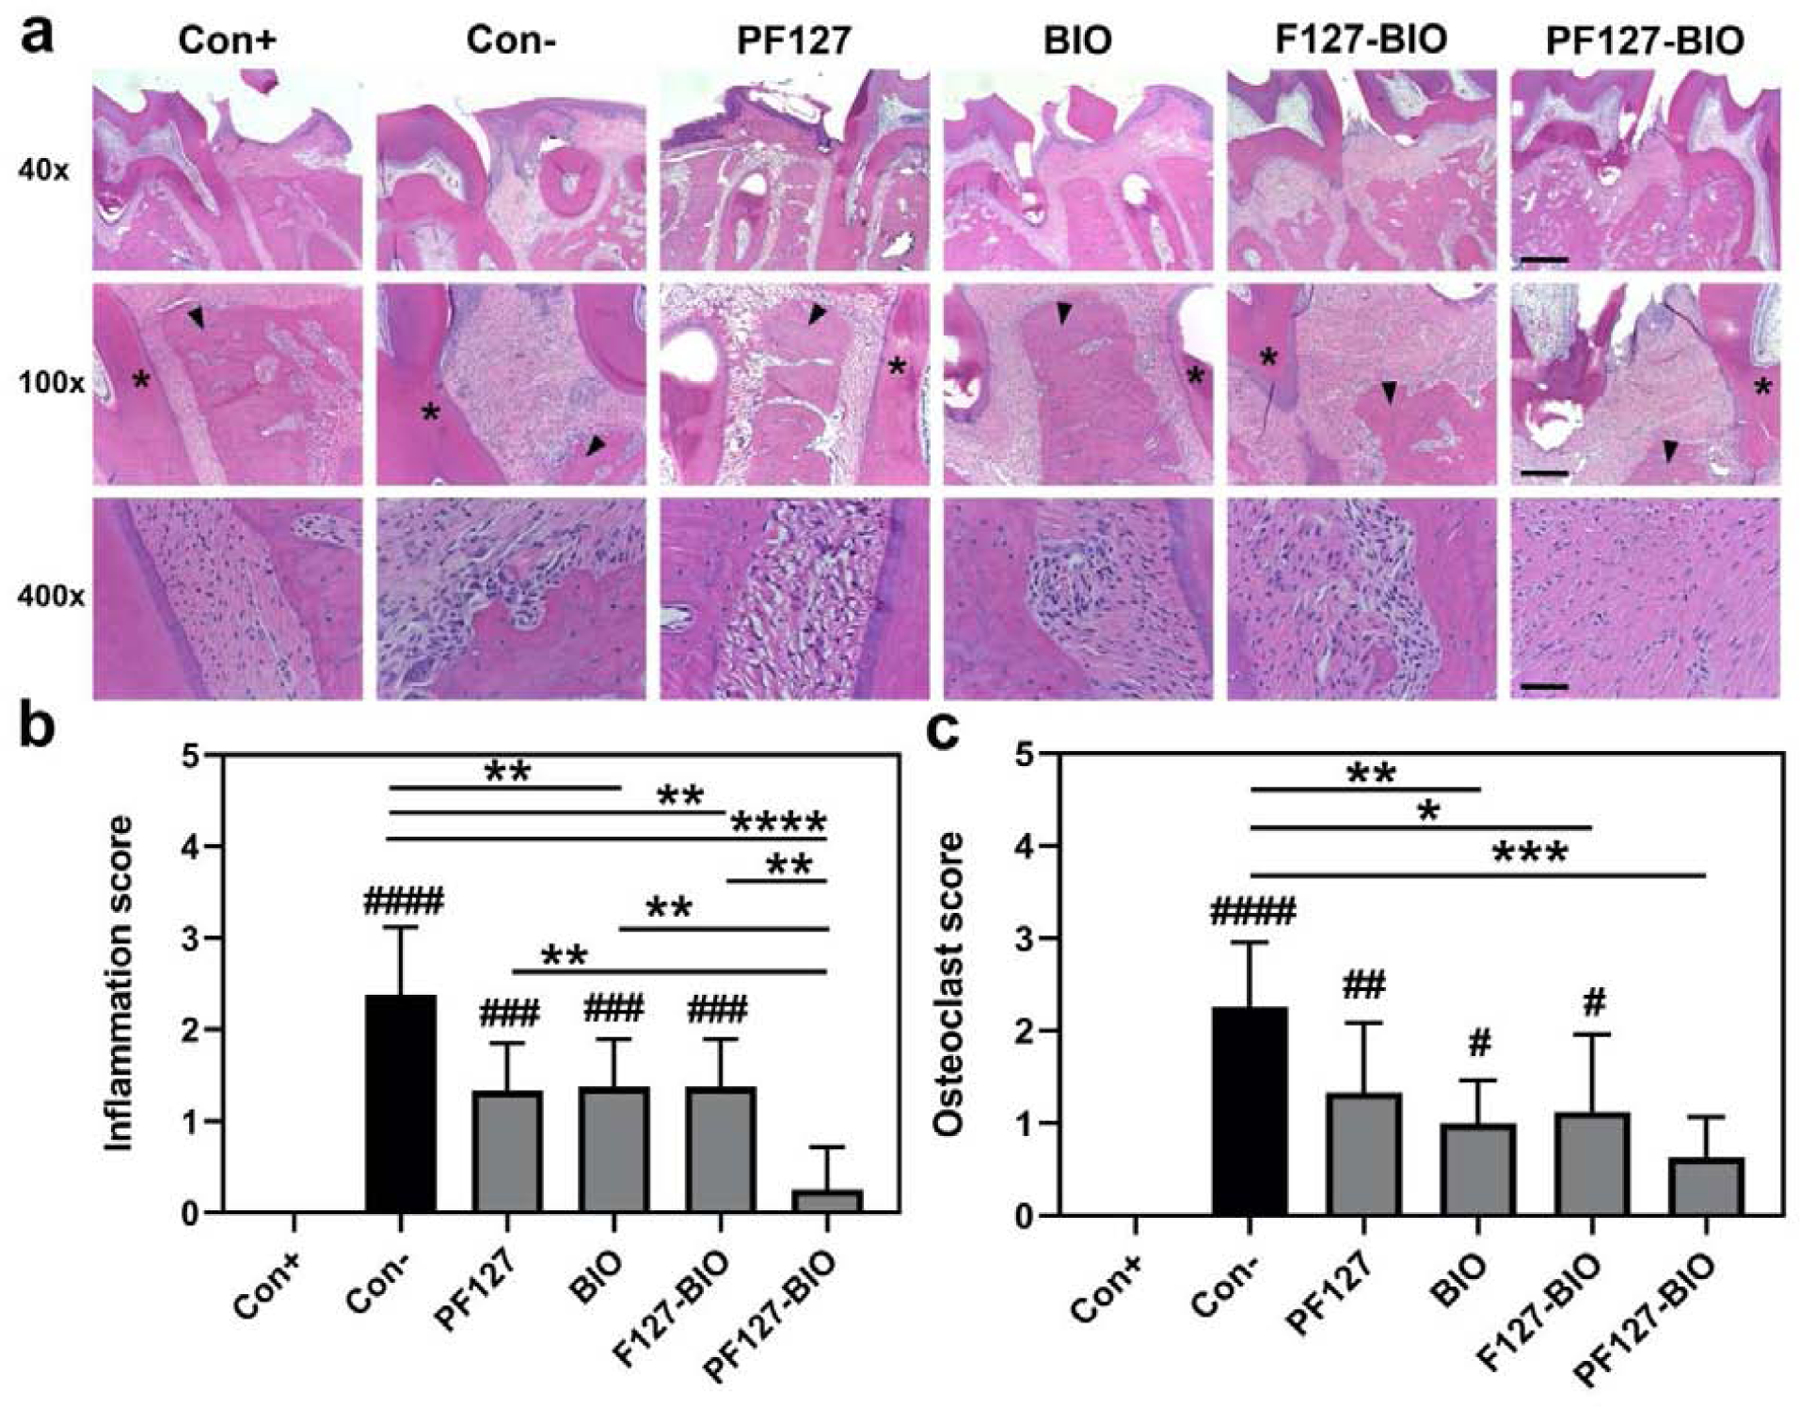
Figure 5.

Histological analysis of papillary connective tissue and alveolar bone between first molar (M1) and second molar (M2) after three weeks of different treatments. (a) Representative images of H&E stained tissue sections from different treatment groups. Semi-quantitative assessment of (b) inflammatory cells and (c) osteoclasts. Values are presented as the mean ± SD. *P < 0.05, **P < 0.01, ***P < 0.001, and ****P < 0.0001. #P < 0.05, ##P < 0.01, ###P < 0.001, and ####P < 0.0001 when compared to Con+ group. (one-way ANOVA). Scale bar = 500 μm, 200 μm and 50 μm for 40x, 100× and 400×, respectively. Black arrows indicate alveolar bone and asterisks indicate first molar (M1).
