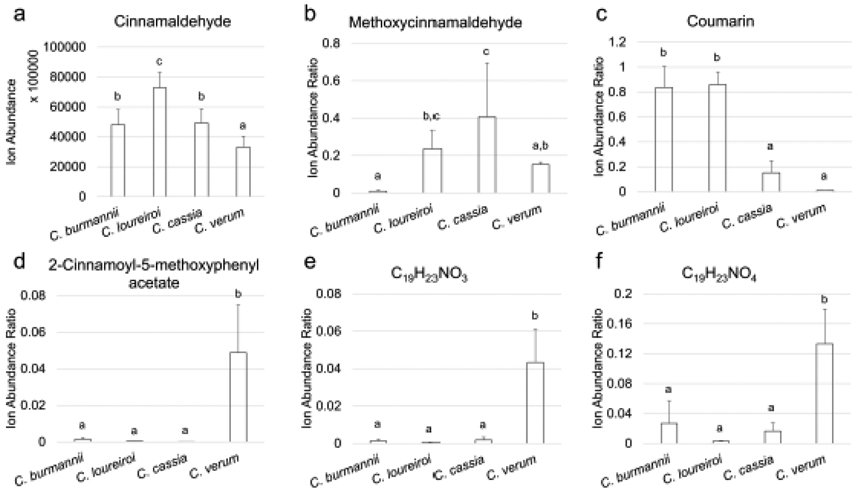
Fig. 3.

Levels of important metabolites in four cinnamon species. Metabolites were determined by PCA and PLS-DA. a: average ion abundance of cinnamaldehyde; b-f: relative ion abundance ratio of other metabolites against cinnamaldehyde. In each chart, value bars labeled with different letters have significant difference (p < 0.05)
