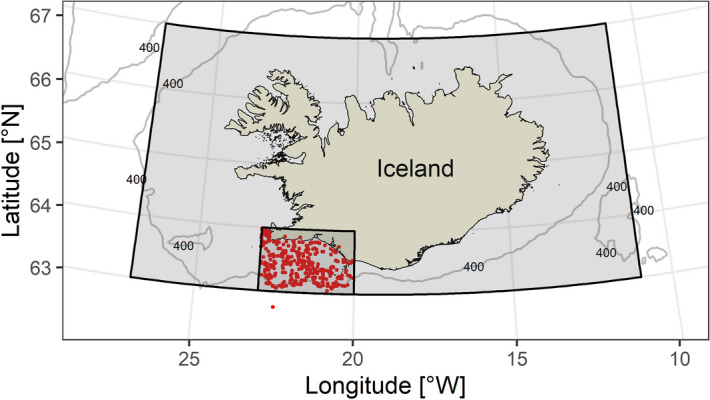
Figure 2.

Atlantic cod (Gadus morhua) sampling locations (red dots). Three land-based locations reflect errors in the capture location data. Shaded polygons indicate areas (smaller—spawning area and larger—Icelandic shelf) over which sea surface temperature (SST) data were averaged. Isobaths of 400 m are indicated with solid lines. This map was generated using R version 3.5.165 based on the GSHHG shoreline database67 and the ETOPO1 bathymetric database68.
