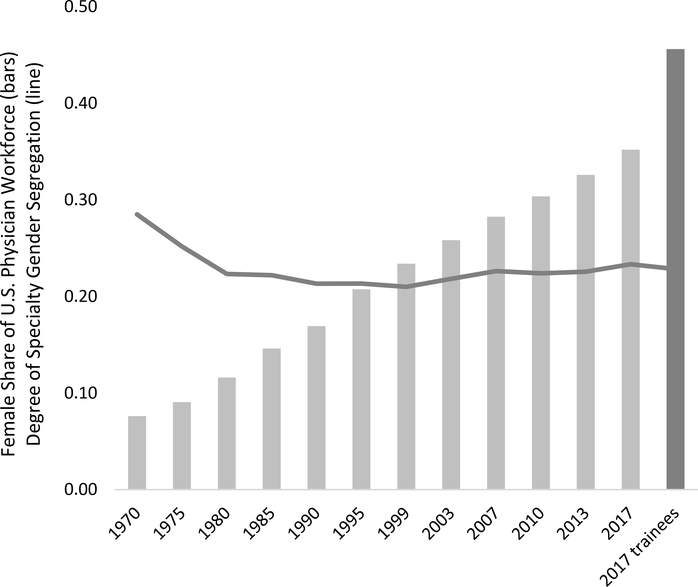
Figure 1.
The increasing female share of the U.S. physician workforce from 1970–20172,34,36–38,59 is shown in the light gray bars (the final dark gray bar indicates data on Accreditation Council on Graduate Medical Education-accredited residency and fellowship programs in 20172). The line indicates the specialty gender segregation, as measured by the index of dissimilarity (the percent of female workers that would need to change occupations in order for men and women to be equitably represented in all occupations), for each of these years. Despite the increase in female physicians (bars) there has been no decrease in gender segregation since 1980.

