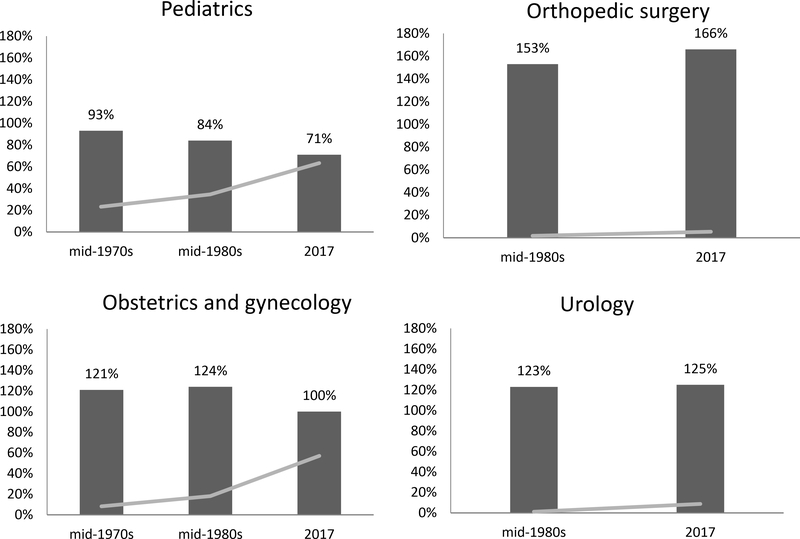
Figure 3.
The dark bars show the average salary for each specialty normalized to the median physician salary at the time points indicated. The female share of each specialty at each time point is indicated by the gray line. The two specialties with a higher female share (left side) have demonstrated a greater than 20% decline in earnings relative to the median physician salary, whereas the 2 specialties with minimal female share (right side) have held steady or increased.

