Figure 4.
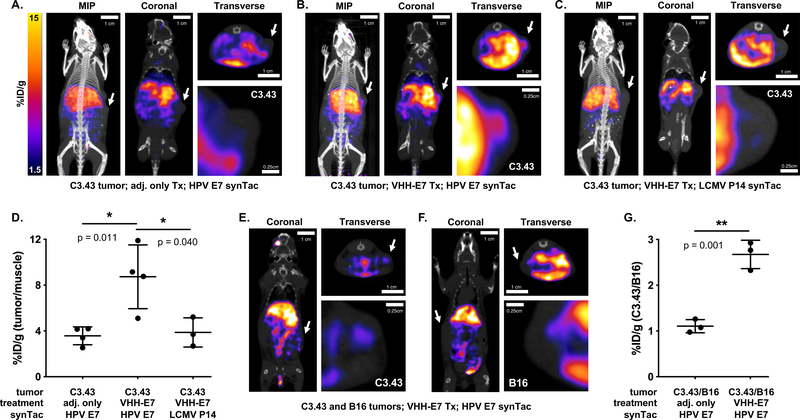
PET-CT imaging with the HPV E7 synTac. A-C) C3.43 tumor-bearing C57BL/6 mice were either treated with adjuvant only (A) or VHHCD11b-E7 (shortened as VHH-E7) plus adjuvant (B-C). ~50 μCi (1850 kBq) 64Cu-labeled HPV E7 (A-B) or LCMV P14 (C) synTac was injected retro-orbitally 7 days after treatment, and PET-CT scanning was performed the next day (8 days after treatment). Representative MIP, coronal, and transverse (cross-section of tumor) PET-CT images are shown with close-up images of the transverse tumor sections in which PET signal is only seen in the tumors of VHHCD11b-E7 treated mice imaged with the 64Cu-labeled HPV E7 synTac (B). White arrows indicate the location of the tumors. D) Quantification of C3.43 intratumoral PET signals over background signal (hindleg muscle) as observed in mice from (A-C) (means ± SD are shown; n = 4/group; *p < 0.05; two-sided Student’s t-test). E-F) C3.43 and B16 co-tumor-bearing mice were treated with VHHCD11b-E7 plus adjuvant. 64Cu-labeled HPV E7 synTac was injected 7 days after treatment, and PET-CT scanning was performed the next day (8 days after treatment). Representative coronal and transverse PET-CT images are shown with close-up images of the tumors. A C3.43 (E; white arrows) and B16 tumor (F; white arrows) are shown separately from the same mouse. PET signal was greater in C3.43 tumors that expressed the appropriate HPV E7 antigen than that of B16 tumors in the same animal. G) Quantification of PET signals observed in C3.43 tumors over those observed in B16 tumors of mice treated with adjuvant only or VHHCD11b-E7 plus adjuvant (means ± SD are shown; n = 4/group; **p < 0.05; two-sided Student’s t-test).

