Figure 6.
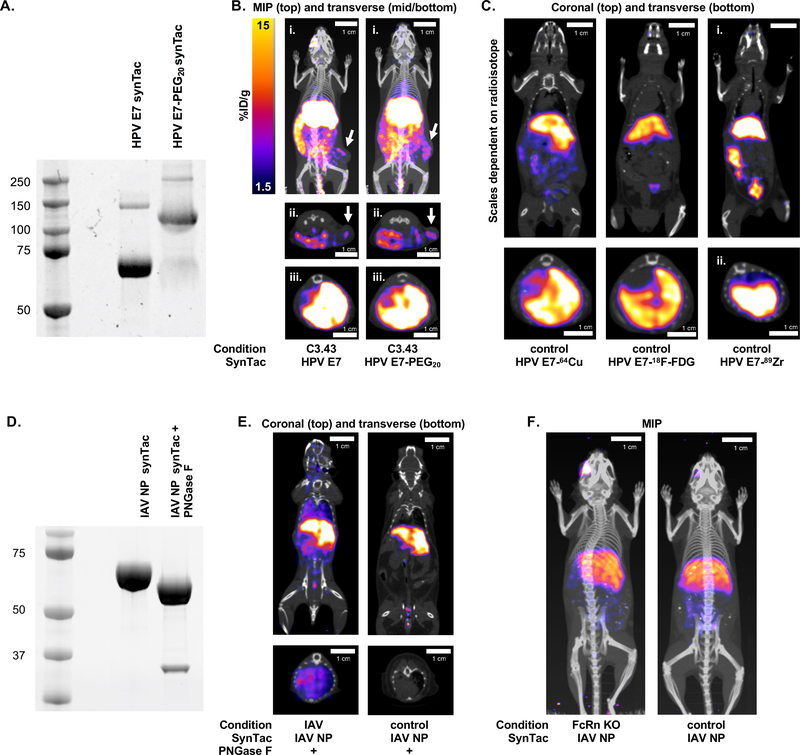
SynTac PET-CT imaging following different radio-labeling strategies. A) G3-NOTA-azide was attached to the HPV E7 synTac via sortase followed by the addition of a 20 kDa PEG (PEG20) moiety (as DBCO-PEG20) with a click reaction. PEGylation of the synTac was verified as an upward size-shift (~40 kDa as two PEG20 moieties are attached per synTac; i.e., one per chain) following PAGE and Coomassie staining (right lane). B) C3.43 tumor-bearing mice were treated with VHHCD11b-E7 plus adjuvant. Mice were then retro-orbitally injected with 64Cu-labeled HPV E7 synTac (left) or PEGylated 64Cu-labeled HPV E7 synTac (right) 7 days after treatment, and PET-CT scanning was performed the next day (8 days after treatment). Representative MIP (i. whole body) and transverse (ii. cross-section of tumors; iii. cross-section of livers) PET-CT images are shown. C) PET-CT scanning was performed on wild-type C57BL/6 mice injected with HPV E7 synTac labeled with 64Cu (imaged the following day), 18F-FDG (imaged 4 hrs after injection), or 89Zr (imaged the following day). Scaling for 64Cu and 18F-FDG are the same as in B and the 89Zr image is scaled at 1.5–30 %ID/g. Representative coronal (top; whole body) and transverse (bottom; cross-section of livers) PET-CT images are shown. D) The IAV NP synTac was pre-treated with PNGase F resulting in deglycosylation of the Fc region as observed by a downward size-shift following SDS-PAGE and Coomassie staining (right lane). The bottom band in the right lane is PNGase F (~36 kDa). E) Mice were injected with PNGase F-digested 64Cu-labeled IAV NP synTac 8 days after IAV infection and PET-CT imaging was performed the next day (9 days after infection) (left). Uninfected control mice were also imaged with the PNGase F-digested 64Cu-labeled IAV NP synTac (right). Shown are representative coronal (top) and transverse (bottom; cross-section of lungs) PET-CT images of an IAV-infected and uninfected mouse. F) FcRn knock-out (KO) and wild-type C57BL/6 mice were injected with 64Cu-labeled IAV NP synTac and PET-CT imaging was performed the next day. Representative MIP PET-CT images are shown. All experiments shown were performed at least three independent times with similar results.

