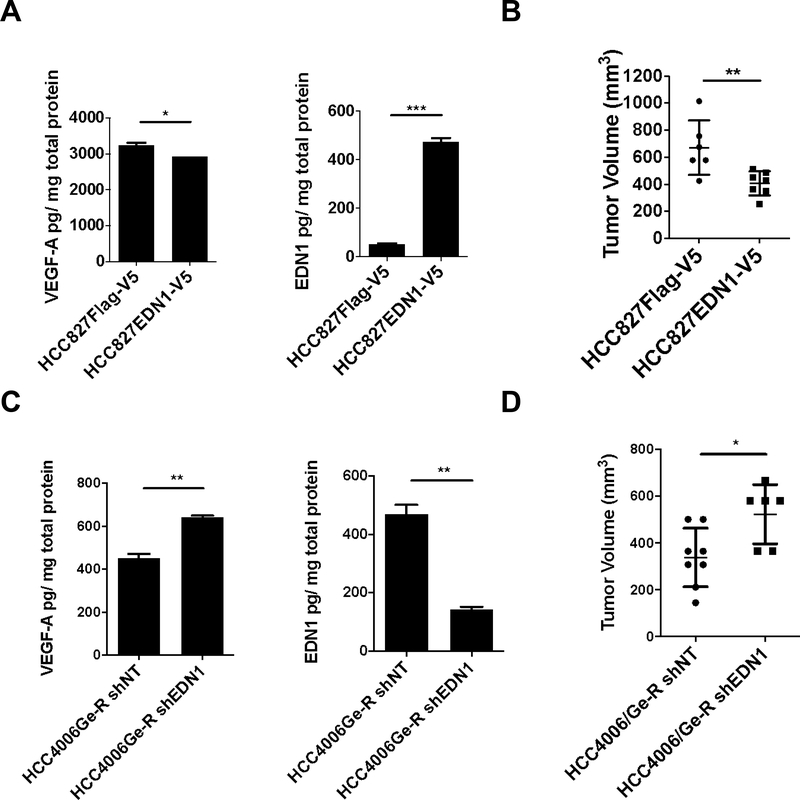
Figure 3. EDN1 expression results in poor in vivo tumor growth.
(A) VEGF-A and EDN1 secretion normalized with protein concentration in HCC827 EDN1 overexpressing cells. Error bars: S.D. t-test *<0.05, ***p<0.001. (B) 5×10⁶ of the indicated cells were engrafted on flanks of mice and allowed to grow for 4 weeks. Error bars: S.D. t-test **p<0.01. (C) VEGF-A and EDN1 secretion normalized with protein concentration in HCC4006Ge-R EDN1 repressed cells. Error bars: S.D. t-test **p<0.01. (D) 5×10⁶ of the indicated cells mixed in a 50:50 ratio were engrafted on flanks of NSG mice and allowed to grow for 4 weeks. Error bars: S.D. t-test *p<0.05.

