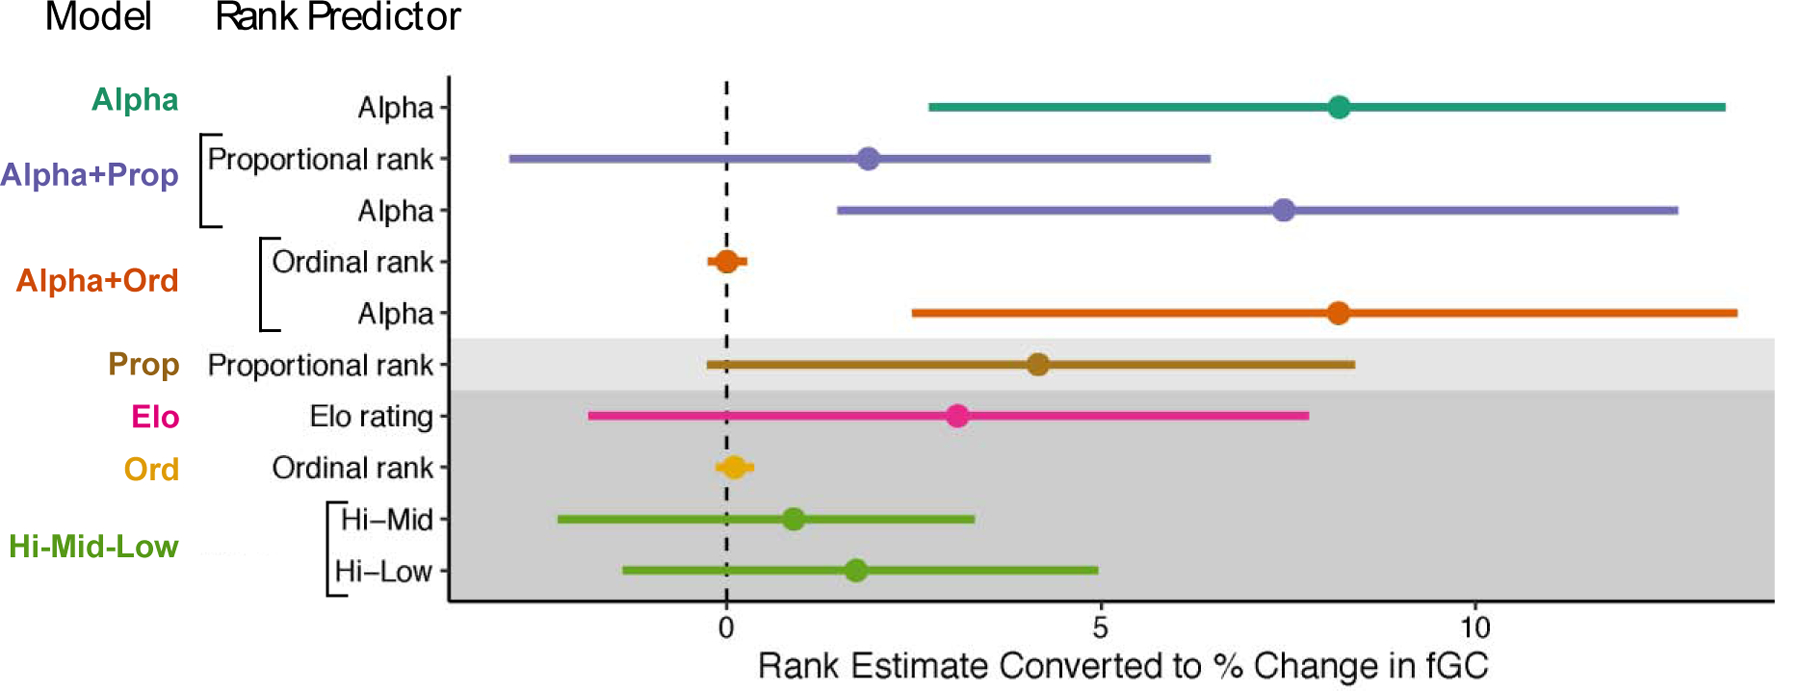
Figure 2.

Comparison of rank estimates across the seven models that contained rank. Estimates (points) and 95% confidence intervals (lines) have been converted to percent change in fGC to facilitate comparison by antilogging, subtracting by 1, and then multiplying by 100. All estimates and confidence intervals are also arranged so that positive values indicate higher fGC concentration in lower-ranking individuals (i.e., values for proportional rank and Elo rating were multiplied by −1). Each model is indicated by a unique color. Models are ordered by AIC value, with the most preferred model, Alpha, at the top. Models that were within 2 AIC units smaller than the Null model are shown with a light grey background, and models that had AIC scores larger than the Null model are showed in with a dark grey background. The ordinal rank coefficients appear small because a one-unit change in ordinal rank is much smaller than a one-unit change in all other predictors.
