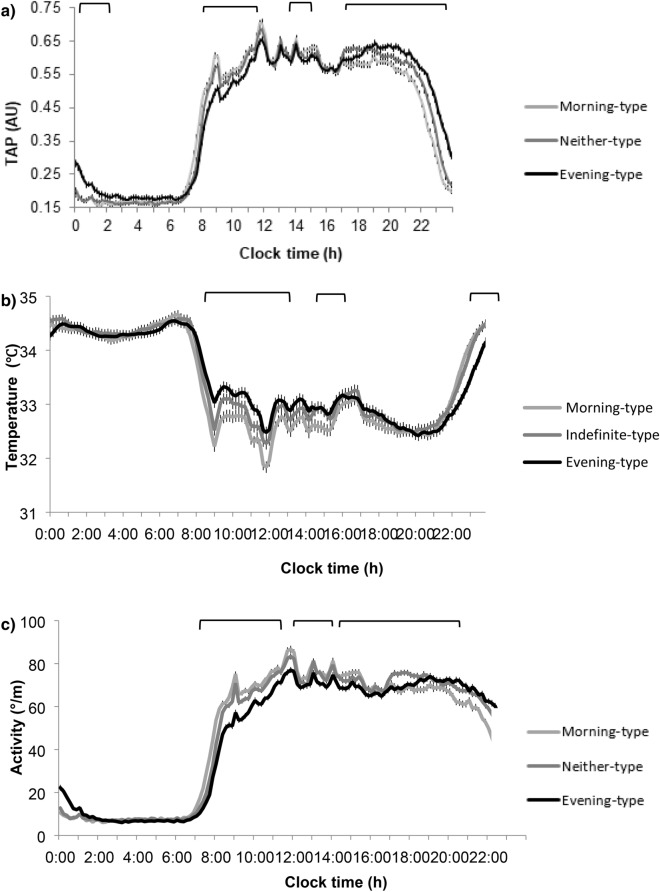
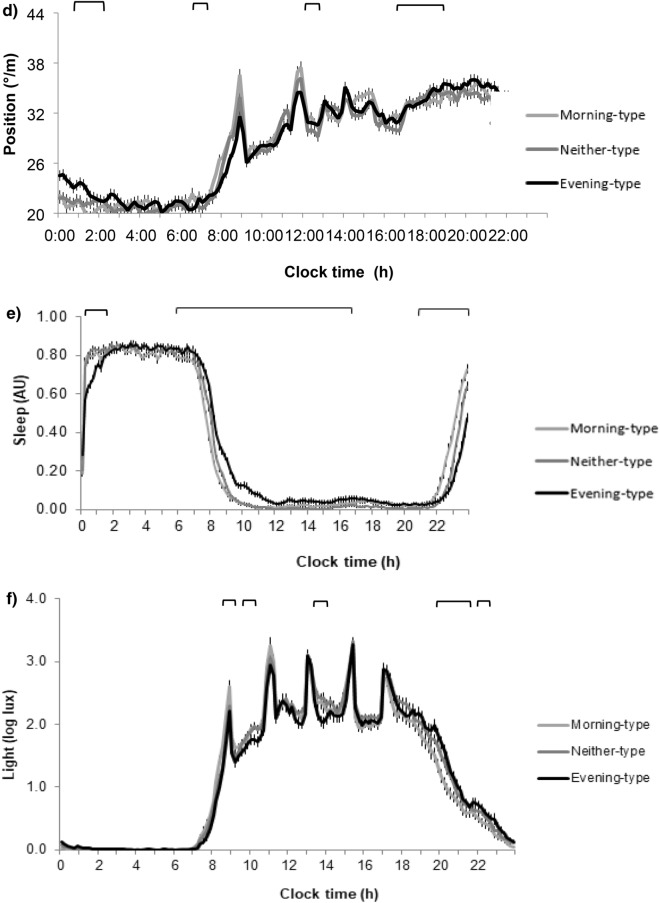
Figure 1.
Average daily patterns recorded over a seven-day period of (a) Integrative variable TAP (from peripheral temperature, activity and position) (n = 432) divided in chronotypes by tertiles, (b) temperature, (c) activity, (d) position, (e) sleep in the total population of (n = 432) and (f) light exposition in a subpopulation (n = 120) in morning, neither and evening chronotypes children. Differences among chronotypes was assessed by ANOVA. The upper brackets represents the hours at which the pattern differs significantly (P < 0.05).


