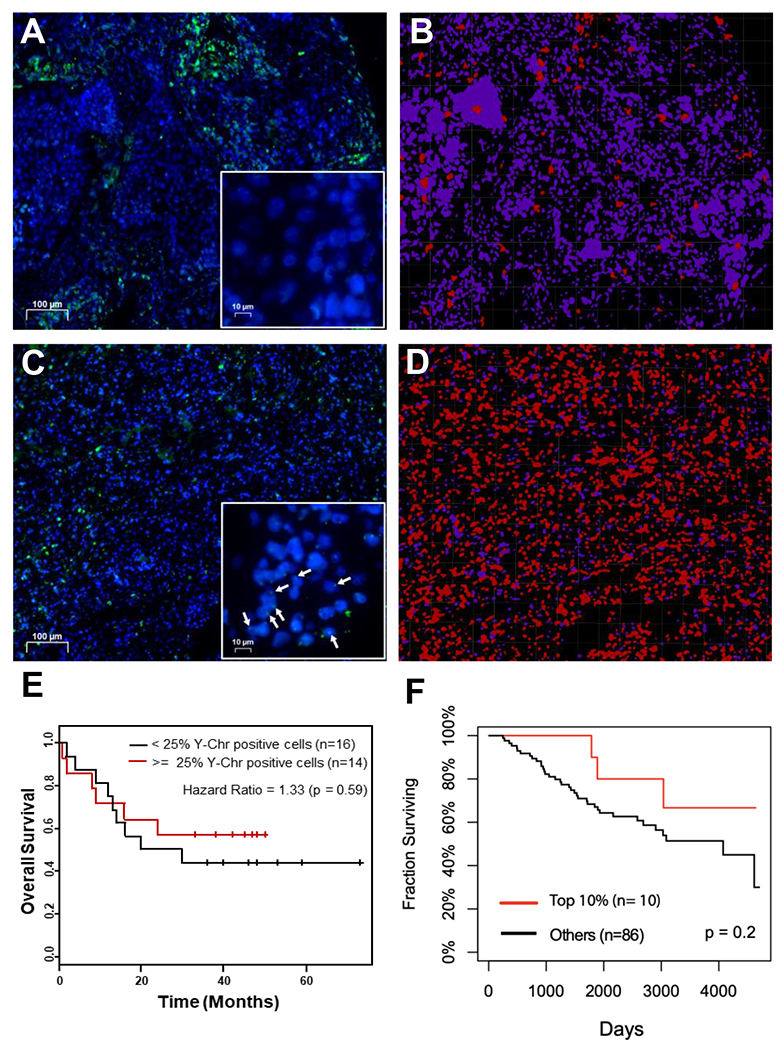
Figure 5: The DYZ1 region of the Y chromosome and the linc-SPRY3 family show negative correlations with patient survival.

(A-D) Representative images from the imaging analysis performed on 30 cores from a lung cancer tissue array to determine the percentage of Y chromosome DYZ1 positive cells. Y chromosome positive cells are red and Y chromosome negative cells are purple. (E) Kaplan-Meier analysis of the 30 cores analyzed for Y chromosome DYZ1 positivity. (F) Survival curves for NSCLC male patients (GSE74777).
