Figure 4.
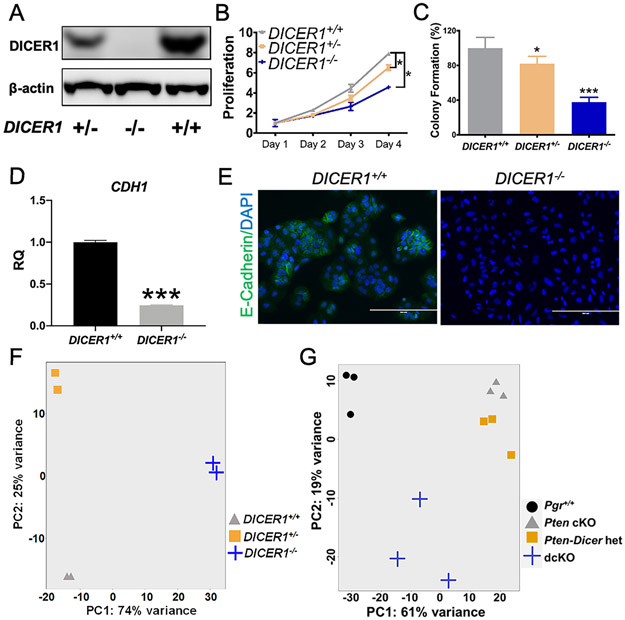
Unique cellular characteristics and transcriptomic profile with loss of two alleles of DICER1. (A) Western blot showed decreased DICER1 protein levels in DICER1+/− and complete loss of DICER1 protein in DICER1−/− cells. Both DICER1+/− and DICER1−/− cells showed a significant decrease in (B) proliferation and (C) colony formation relative to DICER1+/+. Mean ± 95% CI, *, P<0.05, ***, P<0.001. Proliferation data using two-way ANOVA and colony formation data using two-tailed Student's t-test. Expression of cadherin 1 (CDH1 also known as E-cadherin) was high in DICER+/+ cells by qPCR (D) and immunocytochemistry (E), showing a well-differentiated phenotype. In particular, E-cadherin staining was high in the cell membrane in cells touching each other. CDH1 was decreased by qPCR (D) and immunocytochemistry (E), in DICER1−/− cells, showing a loss of well-differentiated phenotype. Mean ± SEM; ***, P < 0.001; two-tailed Student’s t-test; n=6. RQ, relative quantity of CDH1 transcript by qPCR relative to endogenous control gene GAPHD. Immunofluorescent staining of E-cadherin (green) and DAPI. Scale bars, 100 μm. (F) Principal component analysis revealed distinct clustering of human samples in DICER1+/+ (triangles), DICER1+/− (squares), and DICER1−/− (plus sign). (G) Principal component analysis for mouse showed close clustering of Pten cKO (triangles) and Pten-Dicer het (squares) but distinct clustering of Pgr+/+ (circles) and dcKO (plus sign).

