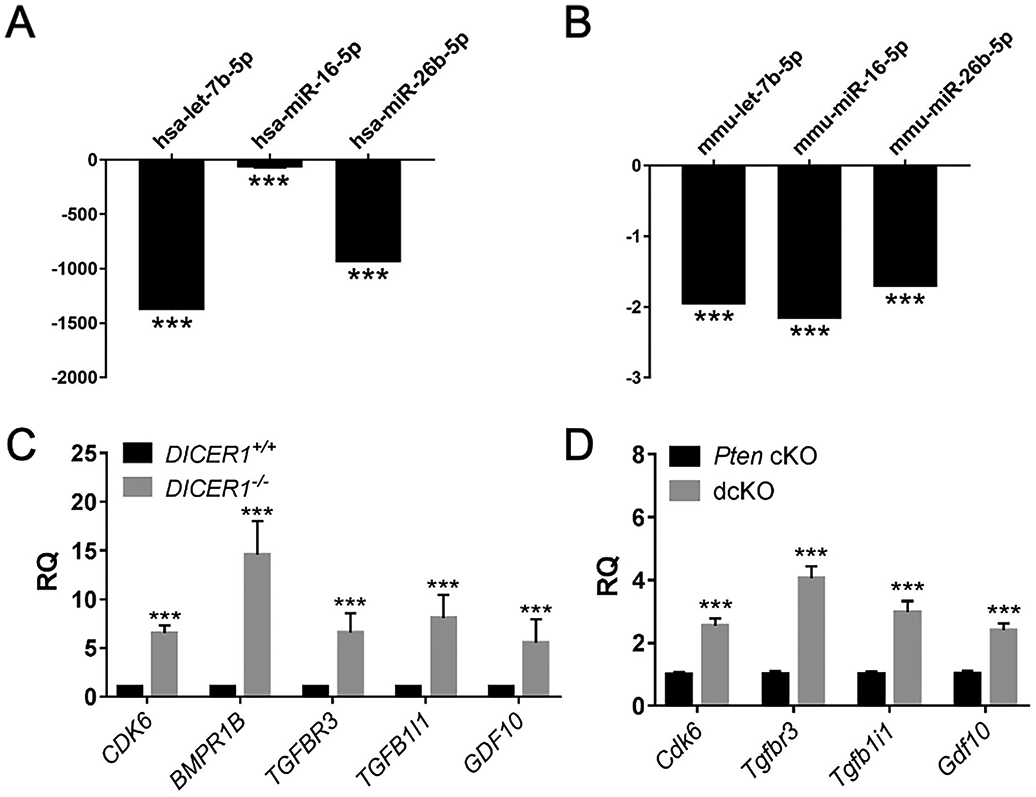
Figure 6.

Downregulated miRNAs and upregulated TGFβ signaling genes. QPCR showed downregulation of miRNAs in human DICER1−/− cells (A) and dcKO mice (B). Mean ± SEM; 2-tailed Student’s t-test; ***, P < 0.001; n = 6; relative quantity of each miRNA by qPCR relative to endogenous control miRNA U6 snRNA (human) and snoRNA202 (mouse) normalized to DICER1+/+ (A) or Pten cKO (B). QPCR showed upregulation of TGFβ signaling genes in human (C) and mouse (D). Mean ± SEM; ***, P < 0.001; two-tailed Student’s t-test; n=6. RQ, relative quantity of each gene transcript by qPCR relative to endogenous control gene GAPHD (human) and 18S (mouse) normalized to DICER1+/+ (C) or Pten cKO (D).
