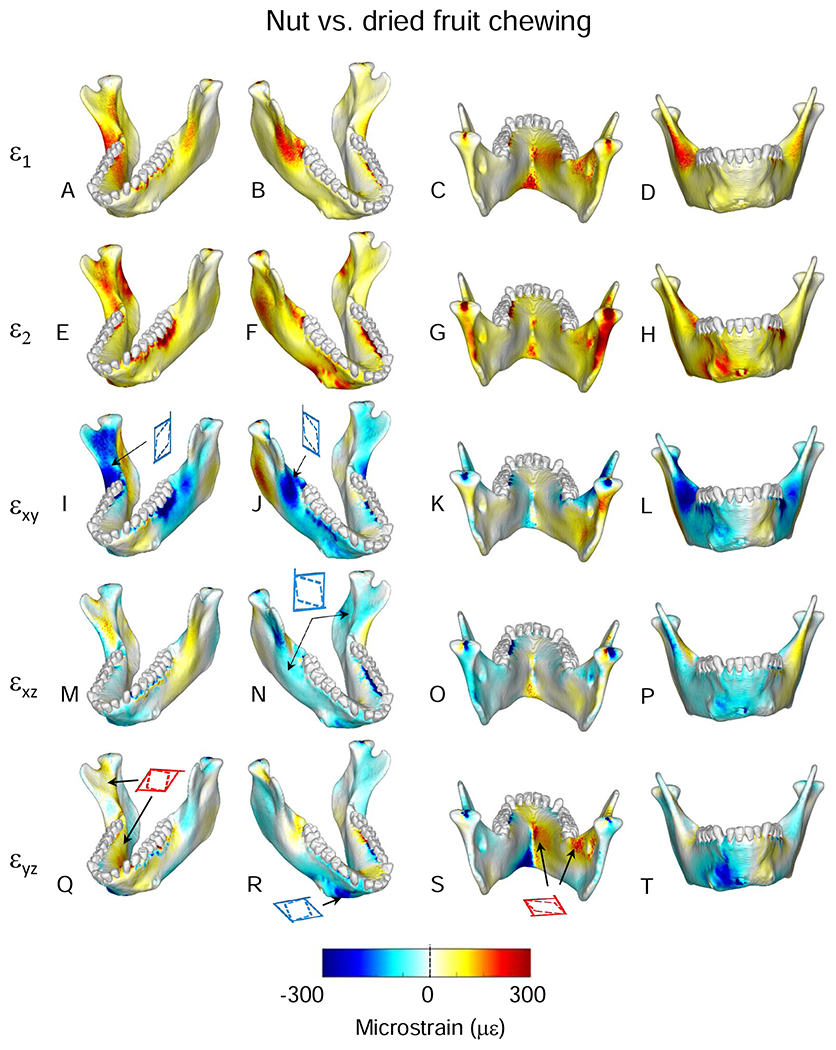
Figure 11.

Comparisons of differences in orientation of principal strains from simulations of mastication of the three food types. Figures map the distribution of the differences in principal strain orientations recorded on the surfaces of the model during simulation of the power stroke of mastication on nuts and dried fruit. The scale bar at the bottom indicates the difference in degrees. Histogram shows number of elements with given differences in principal strain orientations.
