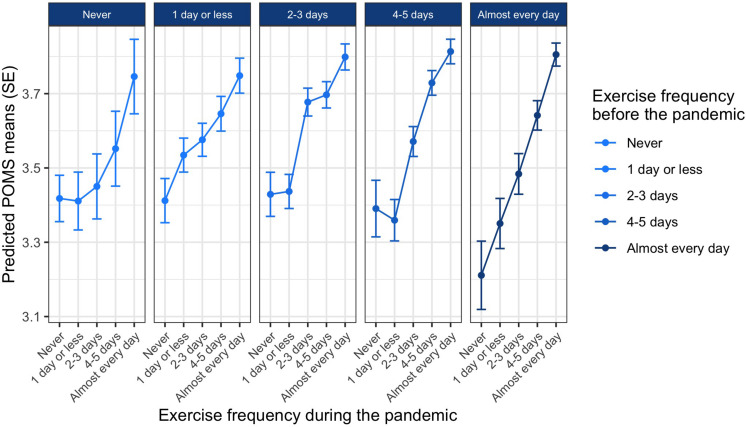
FIGURE 3.
The effect of exercise frequency during the pandemic on mood depending on prepandemic exercise frequency. Lines indicate values for mood during the pandemic (higher values are better mood). Each column indicates exercise frequency before the pandemic, and exercise frequency levels within each column are exercise frequency levels during the pandemic.

