Figure 2.

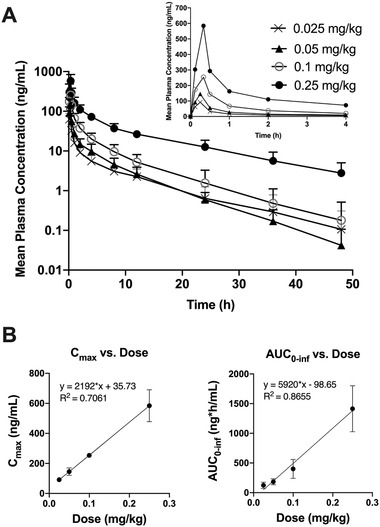
MW189 plasma concentration‐time profiles and dose‐proportional increases in exposure following single ascending doses of MW189. Four escalating doses (0.025, 0.05, 0.10, 0.25 mg/kg) of MW189 were administered as a single intravenous infusion. (A) The mean ± SD concentrations (ng/mL) of MW189 versus time after the dosing (hours) are plotted on a log‐linear scale. The inset graph shows an expansion of the data for the first 4 hours after dosing, plotted on a linear scale. (B) The mean ± SEM of Cmax (maximum observed concentration) and AUC0‐inf (area under the concentration‐time curve from time zero to infinity [extrapolated]) parameters are plotted versus increasing single doses of MW189. Linear regression analyses are consistent with dose proportionality.
