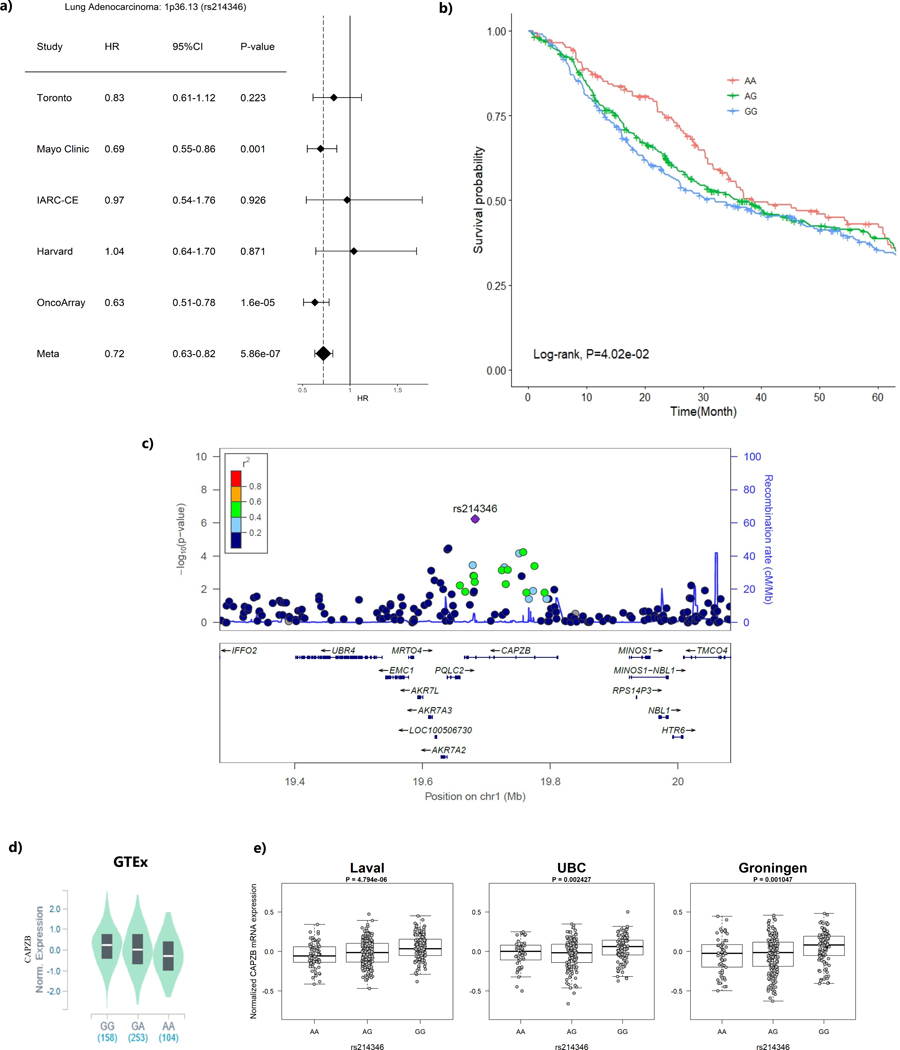
Figure 2. The region ch1p36.13 (represented by rs214346) and lung adenocarcinoma survival.
(a) Forest plots for study-specific hazard ratios (HR) and 95% confidence intervals (CI)
(b) Kaplan-Meier plot by genotype of the sentinel variant over 5-year time period.
(c) Regional plot that include the 1Mb around the sentinel variant rs214346. X-axis represent the chromosome position and Y-axis represent –log10 (p-value) with color representing the linkage disequilibrium with the sentinel variant in r2
(d) eQTL p-value from the GTEx data based on normal lung tissues
(e) eQTL P-values from the Lung eQTL dataset: Laval University, University of British Columbia (UBC) and University of Groningen. The left y axis represents gene expression levels in the lung adjusted for age, sex and smoking status. The x axis represents genotyping groups for rs214346

