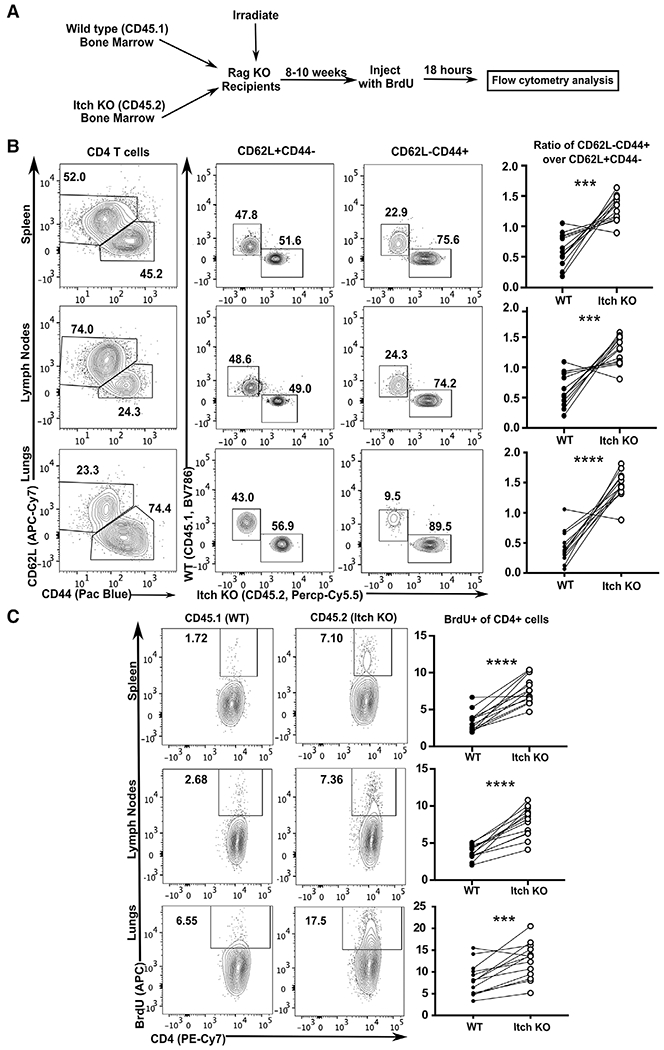
Figure 1.

Itch limits activated CD4 T cell accumulation and proliferation in vivo. (A) Bone marrow was extracted from WT CD45.1 and Itch deficient CD45.2 mice, mixed at a 1:1 ratio of WT: Itch KO, and injected into irradiated Rag-deficient hosts. After reconstitution, mice were injected with BrdU, and 18 h later, tissues were analyzed by flow cytometry. (B) Cells from spleen, lymph nodes, and lungs were stained and gated on Live/Dead negative, singlets, lymphocytes (based on low forward and side scatter), and CD3+CD4+, as displayed in Supporting information Fig. S1A. CD4 T cells were then divided into naïve (CD62L+CD44−) or activated (CD62L−CD44+) populations, and the percent of WT (CD45.1) was compared to the percent of Itch deficient (Itch KO, CD45.2) cells. Quantification shows activated WT cells over naïve WT cells compared to activated Itch KO cells over naïve Itch KO cells. p-values were determined by paired t-test (paired by recipient mouse). p = 0.002 (spleen), p = 0.0005 (lymph nodes), p < 0.0001 (lungs). (C) Cells from spleen, lymph nodes, and lungs were stained and gated on Live/Dead negative, singlets, lymphocytes (based on low forward and side scatter), CD3+CD4+, and CD44+CD62L−, as shown in Supporting information Fig. S1A, representing activated CD4 T cells. The percent BrdU positive was analyzed separately for WT CD45.1 and Itch KO CD45.2 cells. Quantification shows percent of BrdU+ cells within the CD44+CD62L− population for each genotype. p-values were determined by paired t-test (paired by recipient mouse). p < 0.0001 (spleen and lymph nodes), p = 0.0005 (lungs). (BC) n = 13 total mixed chimeras generated from two pairs of bone marrow donors, analyzed over 4 BrdU injection experiments.
