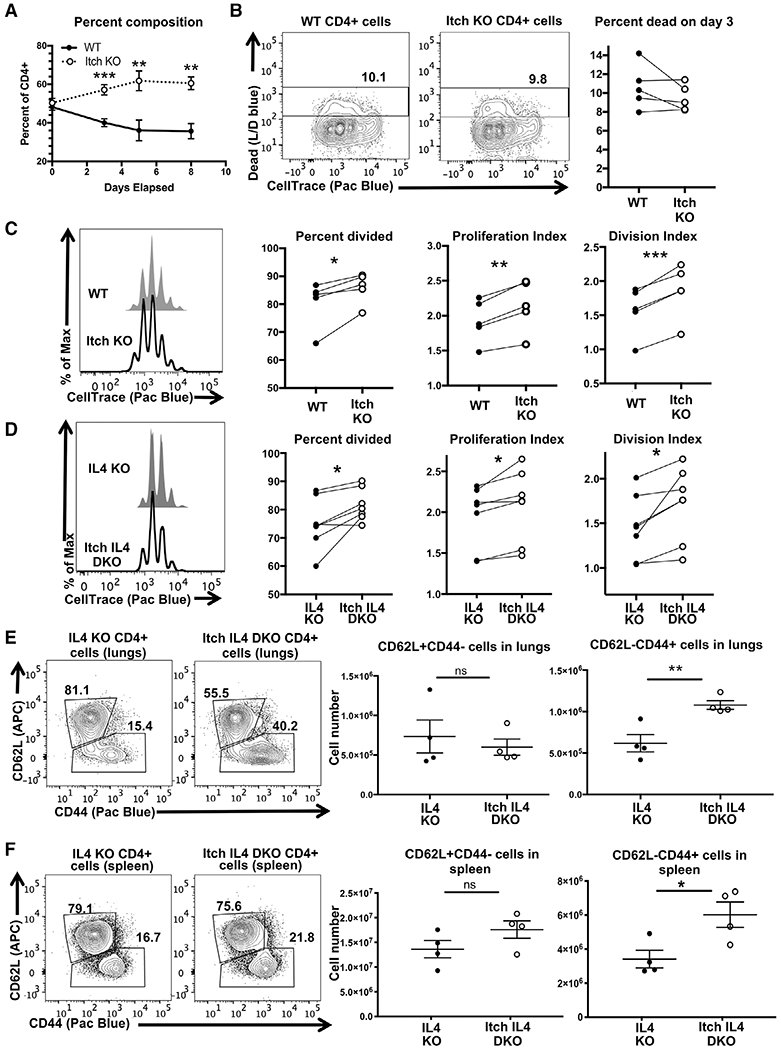
Figure 2.

Itch limits CD4 T cell proliferation in vitro and independently of IL-4. Naïve CD4 T cells were isolated from WT CD45.1, Itch KO CD45.2, IL4 KO CD45.1, and Itch IL4 DKO CD45.2mice. Cells were mixed 1:1 of either WT and Itch KO cells (A-C) or IL4 and Itch IL4 DKO cells (D). Cocultures were labeled with CellTrace violet and cultured in IL-2-containing media on plates coated with anti-CD3 and anti-CD28 antibodies and analyzed by flow cytometry. (A) Cocultures were sampled at the indicated timepoints and stained to determine the relative composition. Cells were gated as displayed in Supporting information Fig. S1B, using the fluorophores BV786 and PerCP-Cy5.5 for CD45.1 and CD45.2, respectively. n = 5 biological replicates over four independent experiments. p = 0.0009 (day 3), p = 0.0085 (day 5), p = 0.0013 (day 8) based on multiple t-tests without correction for multiple comparisons. Error bars represent mean ± SEM. (B) Cell death and CellTrace violet dilution were analyzed on day 3 after plating. Cells were gated as described in (A) and shown in Supporting information Fig. S1, again using fluorophores BV786 and PerCP-Cy5.5 for CD45.1 and CD45.2, respectively. The Live/Dead and FSC-A versus SSC-A gates were omitted to allow for dead cell analysis of CD45.1 and CD45.2 cells separately. n = 5 biological replicates across four independent experiments. p = 0.1969 determined by paired t-test (paired by coculture). (C) The same experiments shown in (B) analyzed for proliferation. Percent divided, division index, and proliferation index were calculated using FlowJo software. n = 5 biological replicates across four independent experiments. p = 0.0245 (percent divided), p = 0.0029 (proliferation index), p = 0.0009 (division index), determined by paired t-test (paired by coculture). (D) Experiment described in (C) using IL4 KO versus Itch IL4 DKO cocultures. Cells were stained, gated, and analyzed as described in (C). n = 7 biological replicates across six independent experiments. p = 0.0232 (percent divided), p = 0.0169 (proliferation index), p = 0.0207 (division index), determined by paired t-test (paired by coculture). Cells from lungs (E) and spleens (F) of IL4 KO and Itch IL4 DKOmice were stained and gated as displayed in Supporting information Fig. S1A, replacing the fluorophore APC for CD62L. The ratio of naïve CD62L+CD44− to activated CD62L−CD44+ cells was analyzed. Cell numbers for each were quantified based on flow data and hemocytometer counts. p-values were determined by unpaired t-test. p = 0.5814 (lungs, CD62L+CD44−), p = 0.0077 (lungs, CD62L−CD44+), p = 0.17 (spleen, CD62L+CD44−), p = 0.028 (spleen, CD62L−CD44+). n = 4 mice of each genotype across three independent experiments. All error bars represent mean ± SEM.
