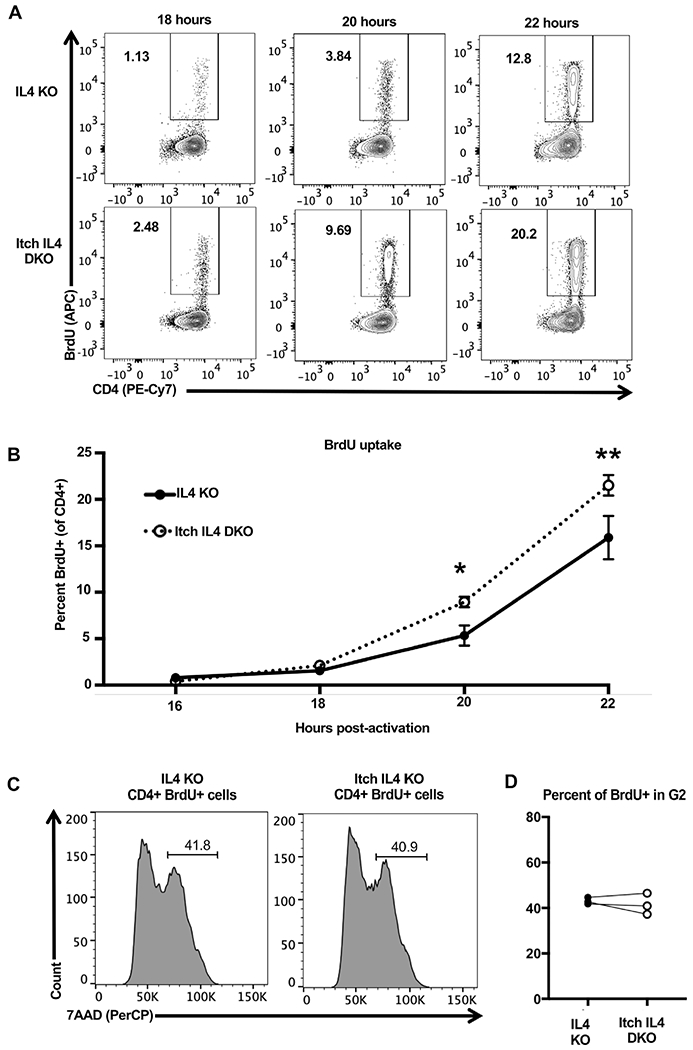
Figure 4.

Itch limits CD4 T cell entry into S phase. Naïve CD4 T cells were isolated from CD45.1 IL4 KO and CD45.2 Itch IL4 DKO mice and activated in IL-2 containing media in coculture with plate-bound anti-CD3 and anti-CD28 antibodies for 22 h. BrdU was added at 15 h postactivation, and cells were sampled at indicated timepoints to measure BrdU uptake as an indicator of S phase entry. Cells were stained and gated on Live/Dead negative, singlets, lymphocytes (based on forward scatter and side scatter), CD4+, and CD45.1 or CD45.2, as shown in Supporting information Fig. S1. The percent BrdU+ of CD45.1 IL4 KO or CD45.2 Itch IL4 DKO cells was analyzed by flow cytometry. Representative flow plots are shown in (A) and all experiments quantified in (B). n = 5 mice of each genotype across three independent experiments. p-values were determined by multiple t-tests. p = 0.019 (20 h), p = 0.00050 (22 h). Error bars represent mean ± SEM. (C) Naïve CD4 T cells were isolated from CD45.1 IL4 KO and CD45.2 Itch IL4 DKO mice and activated in coculture with plate-bound anti-CD3 and anti-CD28 antibodies. Cells were cultured in IL-2-containing media. BrdU was added at 28 h after activation. Cells were harvested, stained, and fixed at 30 h after activation. After fixing, cells were dyed with 7AAD to measure DNA content. Cells were gated on Live/Dead negative, singlets, lymphocytes (based on forward scatter and side scatter), CD4+, CD45.1+, or CD45.2+, and BrdU+, as displayed in Supporting information Fig. S1. n = 3 mice across two independent experiments. p = 0.5588, analyzed by paired t-test (paired by coculture).
