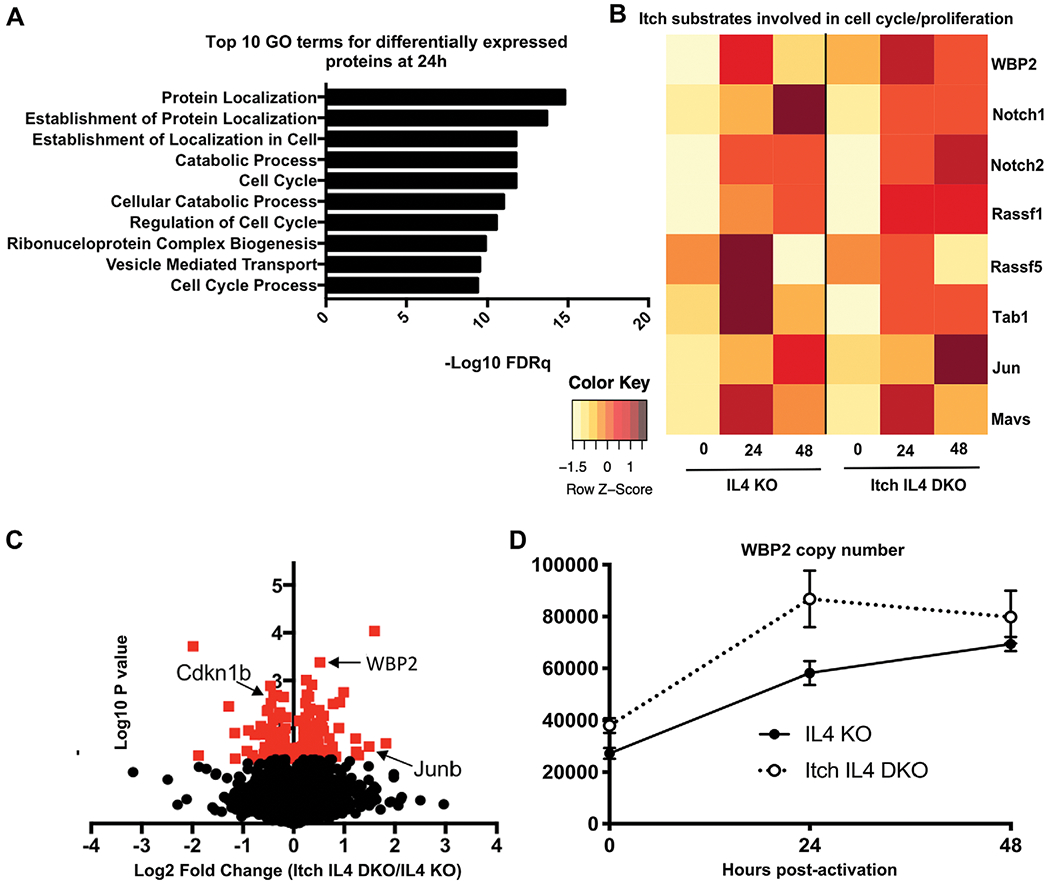
Figure 5.

Whole cell proteome analysis reveals a role for Itch in regulating cell cycle proteins. CD4 T cells from spleen and lymph nodes of IL4 versus Itch IL4 DKO mice were activated with anti-CD3 and anti-CD28 antibody in IL-2-containing media for 0, 24, or 48 h. Whole cell proteomes were analyzed by mass spectrometry. n = 3 biological replicates (combined cells from two mice each) across three independent experiments. (A) Top 10 hits for Gene ontology (GO) term analysis on differentially expressed proteins (upregulated or downregulated) at 24 h postactivation. GO analysis was performed using the Broad Institute Molecular Signatures Databases. (B) Average abundance of select putative Itch targets at 0, 24, and 48 h postactivation in each genotype. All proteins shown here were detected in at least two of three replicates at one timepoint for both genotypes. Each undetected protein in a given replicate was assigned a value equal to the limit of detection. Average intensity values for each protein were normalized to the average intensity value for β-actin for that sample. Heat map is scaled by row. (C) Volcano plot of log2 fold change of proteins identified in naïve Itch IL4 DKO CD4 T cells over those identified in naïve IL4 CD4 T cells. Proteins normalized to the median protein in each sample. Red indicates p < 0.05 based on unpaired t-test. (D) WBP2 abundance in each sample, based on calculated protein copy number per cell. Error bars indicate mean ± SEM.
