Figure 7.

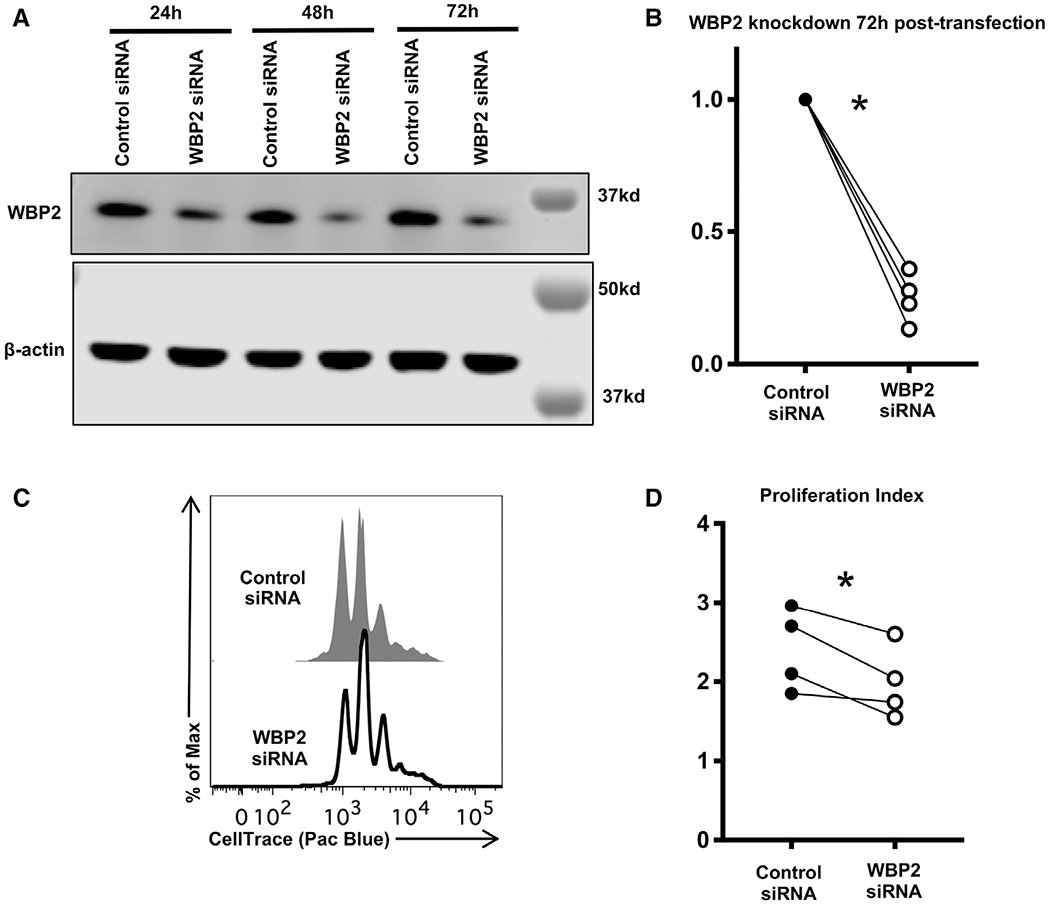
WBP2 promotes CD4 T-cell proliferation. Naïve T cells were isolated from WT mice, labeled with CellTrace violet and activated using plate-bound anti-CD3 and anti-CD28 in IL-2-containing media for 24 h, then transfected with either nontargeting control siRNA or siRNA specific for WBP2. (A) Representative Western showing WBP2 levels in transfected cells. Western blots were probed as described in Fig. 6. Timepoints refer to timing post-transfection, which was 24 h after initial activation. (B) Quantification of WBP2 protein knockdown. Each sample is normalized to β-actin. Each WBP2 siRNA-treated sample was normalized to its corresponding control siRNA-treated timepoint. p-values were calculated by paired t-test, pairing cells from the same mouse. p = 0.0006 (72 h). (C) Representative flow analysis of proliferation 72 h post-transfection. Cells were not stained to avoid further stress and cell loss; live lymphocytes were identified on the basis of forward scatter and side scatter as shown in Supporting information Fig. S1. (D) Quantification of proliferation across all experiments. Proliferation index was calculated using FlowJo software, which determines the number of cells in each peak. p = 0.0399, determined by paired t-test, pairing control versus WBP2 siRNA-treated cells from the same mouse. (A-D) n = 4 biological replicates across three independent experiments.
