
Fig. 2.
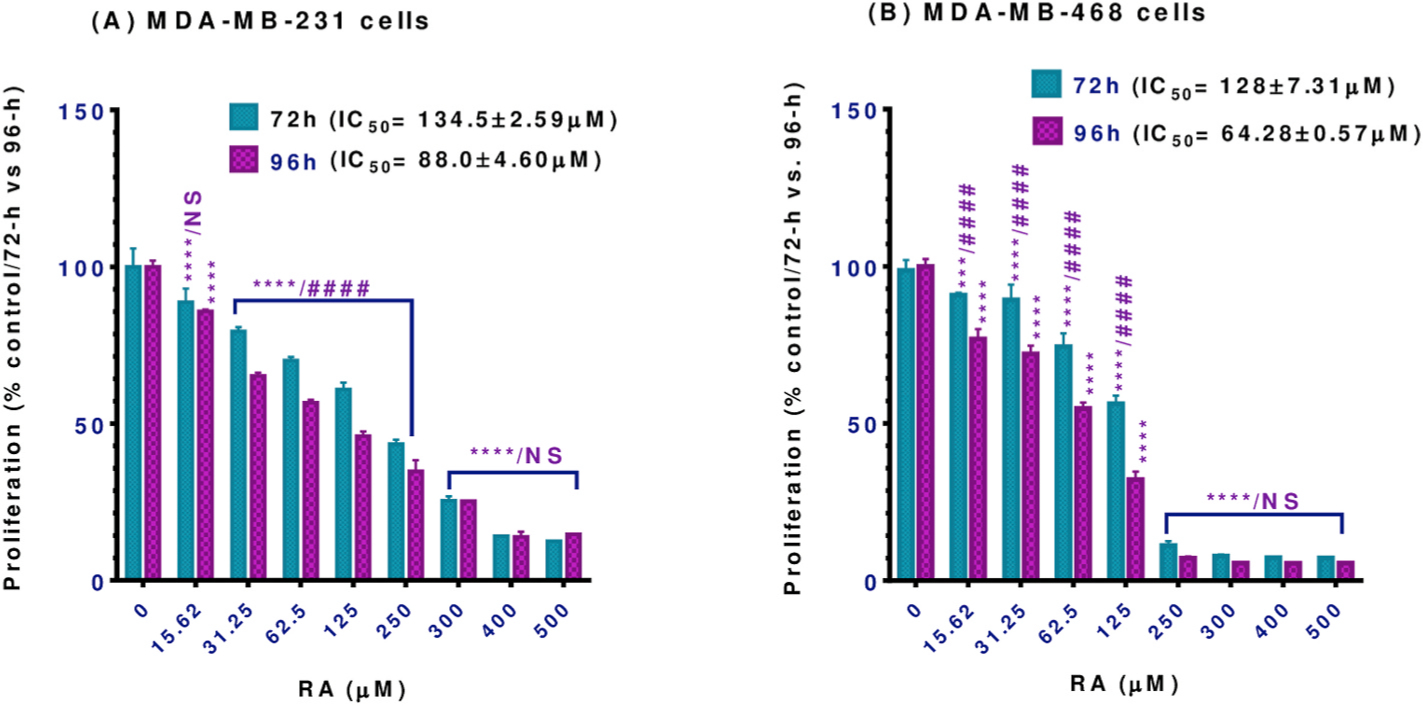
Effect of RA on proliferation in (A) MDA-MB-231 and (B) MDA-MB-468 TNBC cell lines. Both cell lines were incubated for 72 and 96 h with RA at concentration ranges of 0–500 μM. Each data point represents the mean ± S.E.M. of two independent experiments, n = 5 each. One-way ANOVA tests were used to calculate P -values for the difference between control vs. 72 or 96h exposure (*) and two-way ANOVA tests were used to calculate P-values for the difference between the different exposure periods (#). Both one-way and two-way ANOVA analyses were followed by Bonferroni’s multiple comparisons test. ***P < 0.001 and ****/####P < 0.0001 indicate a statistically significant difference between control vs. different exposure periods or between 72 vs. 96h exposure periods. NS, non-significant.