
Figure 4. Tumor organoid-vessel interactions.
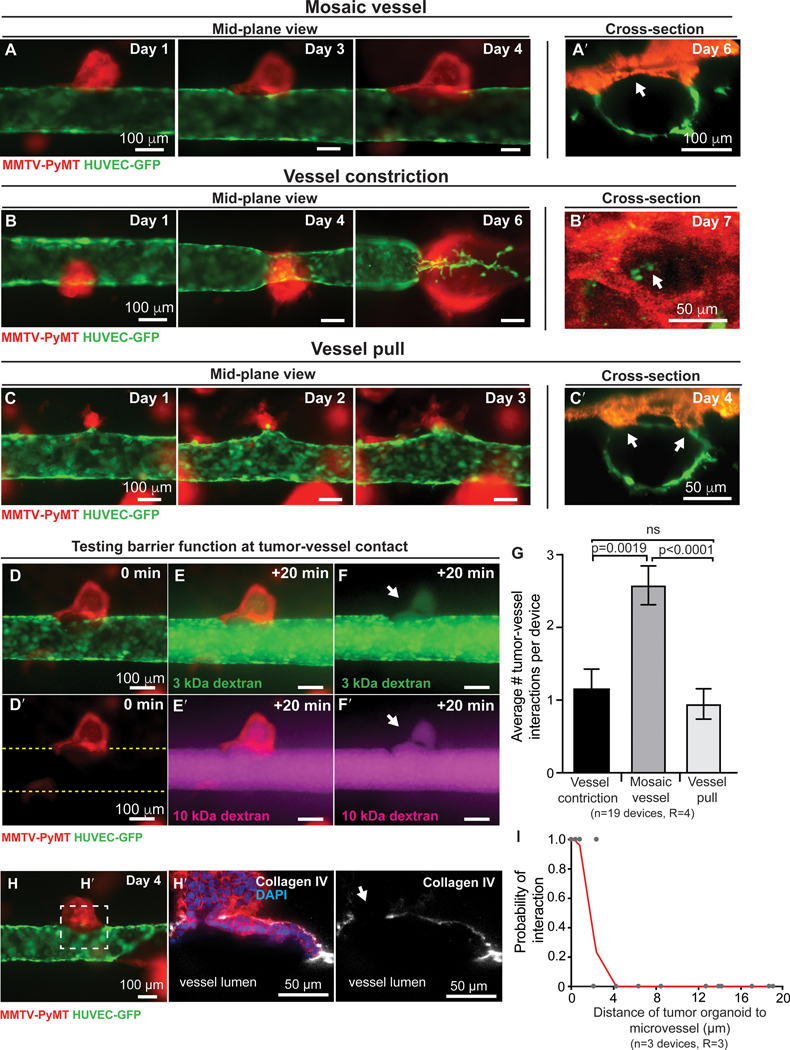
(A-C’) Time-lapse images of a ROSAmTmG; MMTV-PyMT tumor organoid growing near a microvessel (green), with flow at 1mL/hour, shear stress of 4 dynes/cm2, and images oriented with flow from left to right. 2D mid-vessel images in A-C and cross section of 3D z-stack in A’-C’. (A-A’) Organoid integrates into the vessel wall, with arrow marking gap in endothelial lining. Scale bar: 100 μm. (B-B’) Organoid wraps around and constricts the vessel (arrowhead). By day 5, the flow rate decreased to less than 0.1 mL/h, resulting in increased intraluminal pressure and upstream vessel expansion. Scale bar: 50 μm. (C-C’) Organoid pulls on and deforms the vessel wall. Scale bar: 50 μm. (D-F’) Time-lapse images showing retention of barrier function at site of tumor organoid integration into vessel wall, with 3 kDa dextran (E-F) and 10 kDa dextran (E’-F’) shown. Time= 0 min represents the frame prior to luminal filling and +20 minutes demonstrates retention of the tracer molecules. Scale bar: 100 μm. (G) Quantification of tumor-vessel interaction, revealing that mosaic vessel formation is the most frequent. n= number of vessel devices across 4 biological replicates. Error bars indicate s.e.m. and p values were determined by ANOVA, with p< 0.05 considered significant. (H) 2D image of a mosaic vessel formed when a ROSAmTmG; MMTV-PyMT tumor organoid integrated into the vessel wall. Scale bar: 100 μm. (H’) Inset showing staining for collagen IV (white) and DAPI at the site of tumor vessel-contact reveals a gap in the basement membrane. Scale bar: 50 μm. (I) Probability of tumor-vessel interaction as a function of the initial distance of the organoid to the microvessel. A non-linear probit regression analysis was conducted, which considered the dependent variable to be binary (121 observations: 101 with no interaction and 20 with interaction). Observed distances ranged from 0 to 711 μm, while the plot reports from 0 to 20 μm. The probit regression analysis Pseudo R2 was 0.95, suggesting high empirical model fit.