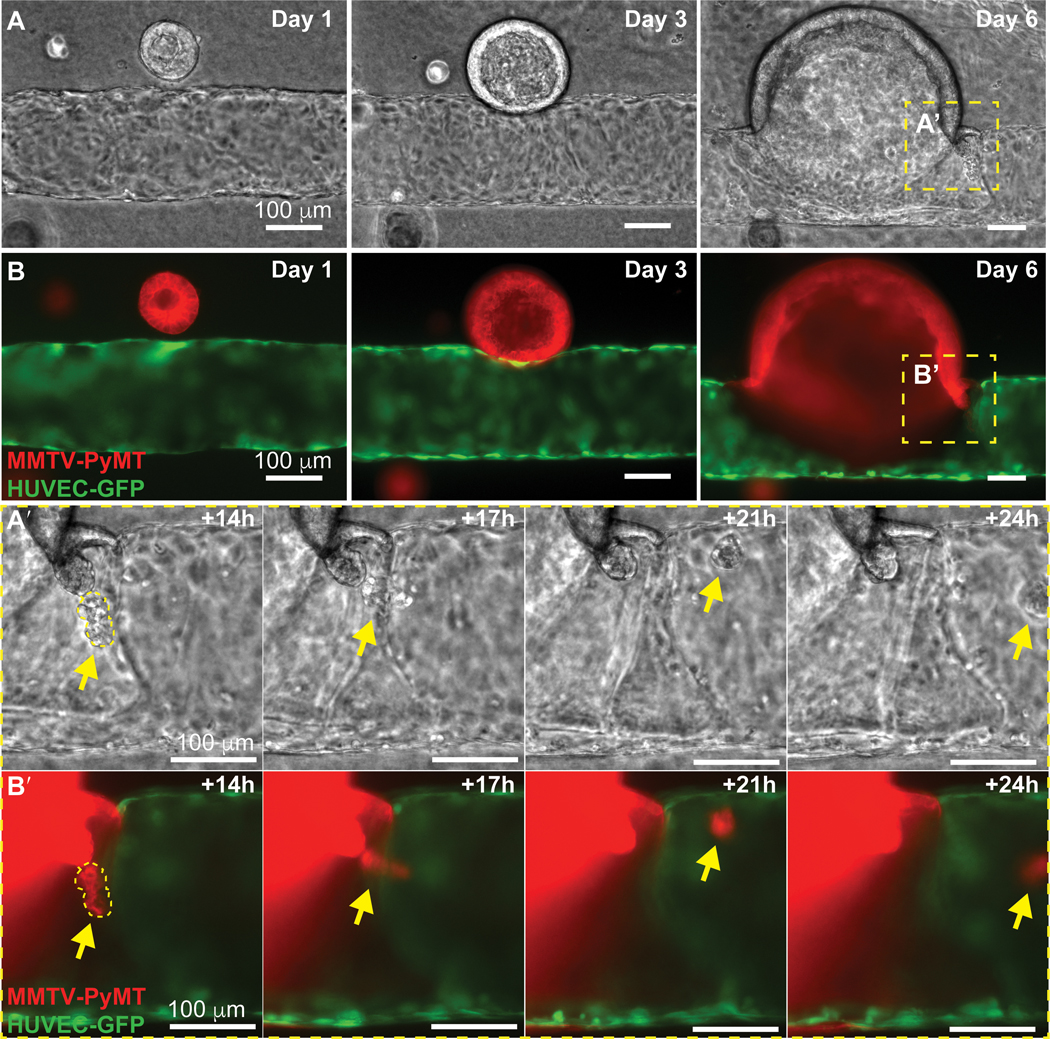
Figure 5. Intravasation of a tumor cluster following mosaic vessel formation.

Frames from a representative (A) phase contrast and (B) fluorescence time-lapse movie of a ROSAmTmG; MMTV-PyMT tumor organoid and a HUVEC microvessel (GFP). Insets of phase (A’) and fluorescent (B’) time-lapse images showing a tumor cluster shedding into the vessel lumen under continuous flow (yellow arrows). The flow rate is kept at 1mL/hour and shear stress at 4 dynes/cm2. Direction of flow is from left to right. Scale bars: 100 μm.
