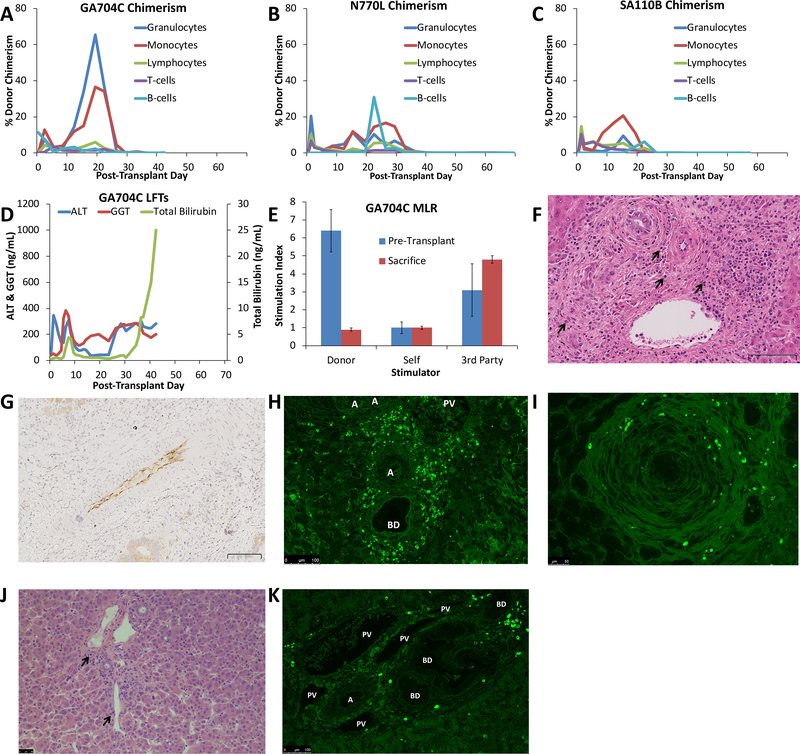
Figure 4: Results of Liver Transplants Without Rituximab.
(A-C) Percent Donor Chimerism. Animal numbers are indicated above graphs. Blue lines show the %Donor Granulocytes, Red lines show %Donor Monocytes, Green lines show %Donor Lymphocytes, Purple lines show %Donor CD3+ T cells; Light Blue lines show %Donor CD20+ B cells. Lymphocyte chimerism peaked early after transplant while the myeloid lineages peaked in the 3rd week after transplant. All animals lost chimerism after the 5th week post-transplant; (D) Liver function tests of GA704C. Blue lines show AST values, Red lines show ALT values, green lines show Total Bilirubin values. There was a rapid rise of LFTs after immunosuppression withdrawal; (E) Mixed Lymphocyte Reaction for Animal GA704C. MLR were performed pre-transplant (blue bars) and at the time of sacrifice (red bars). Responses are shown to donor stimulators, self-stimulation and 3rd-party stimulators and express as stimulation index normalized to negative controls without stimulators. GA704C demonstrated donor-specific unresponsiveness at the time of sacrifice. Error bars represent Std Dev; (F) GA704C liver POD 42 showing diffuse cellular infiltration with many plasma cells (black arrowheads) H&E 25x. Scale bar indicates 100 μm; G) Immunohistochemistry of GA704C showed diffuse C4d deposition in hepatic arteries at POD 42. 18x, scale bar indicates 100 μm; (H) Immunofluorescence for IgG of GA704C liver showed diffuse plasma cell infiltration on POD 42. Scale bar indicates 100μm. A-artery, BD- bile duct; (I) Immunofluorescence for IgG of GA704C autologous pancreas on POD 42 also showed plasma cell infiltration indicating a non-specific plasma cell response. Scale bar indicated 50 μm; (J) Liver histology of GR677K on POD 10 had minimal cellular infiltration while still on immunosuppression with scattered plasma cells (black arrowheads). Scale bar indicates 50 μm; (K) Immunofluorescence for IgG of GR677K liver biopsy shows scattered IgG-positive plasma cells. Scale bar indicates 100 μm. A-artery, BD-bile duct; PV-portal vein.

