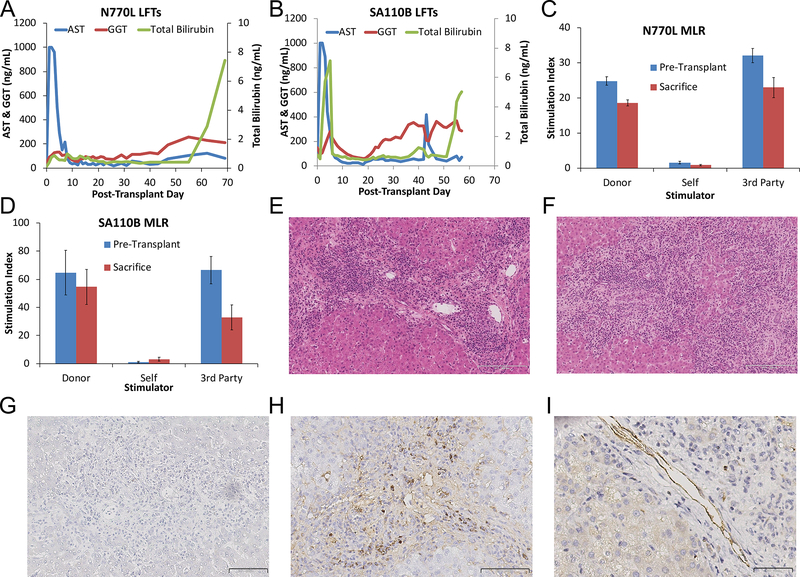
Figure 5: Results of Liver Transplants with Rituximab:
(A, B) Liver function tests of animals treated with rituximab. Animal numbers are indicated above graphs. Blue lines show AST values, Red lines show ALT values, green lines show Total Bilirubin values. All animals had rapid rise of LFTs after immunosuppression withdrawal; (C, D) Mixed Lymphocyte Reactions. Animal numbers are indicated above graphs. MLR were performed pre-transplant (blue bars) and at the time of sacrifice (red bars). Responses are shown to donor stimulators, self-stimulation and 3rd-party stimulators and express as stimulation index normalized to negative controls without stimulators. N770L and SA110B maintained anti-donor responses after immunosuppression withdrawal. Error bars represent Std Dev. (E) Liver histology on POD 69 for N770L demonstrated Banff 8/9 acute cellular rejection. H&E, 14x, Scale bar indicates 200 μm; (F) Liver histology for SA110B on POD 57 revealed Banff 9/9 acute cellular rejection. H&E, 13x scale bar indicates 200 μm; (G) Immunohistochemistry for IgG on SA110B POD 57 liver tissue showed no plasma cell infiltration. 22x, scale bar indicates 100 μm; (H) Immunohistochemistry for IgG on N770L POD 69 liver tissue showed scattered plasma cell infiltration. 27x, scale bar indicates 200 μm; (I) Immunohistochemistry for C4d showed deposition on endothelium. 40x, scale bar indicates 50 μm.

