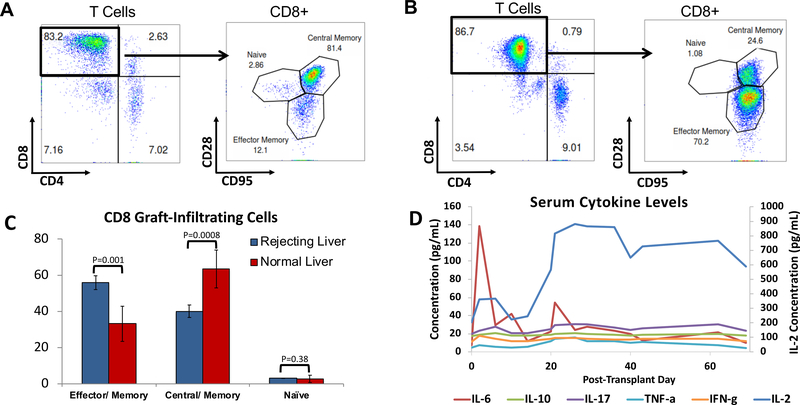
Figure 7: Resident and Graft-Infiltrating Lymphocytes of liver biopsies and cytokine levels.
(A) Resident T cells in normal livers are predominately CD8, among which Tcm dominate. (B) Graft infiltrating T cells are also predominately CD8 cells but are comprised of more Tem. (C) Resident CD8 T cells in the liver shifts from predominately Tcm to Tem in rejecting livers, with almost no Tn cells Error bars represent Std Dev. (D) Average levels of serum cytokines in peripheral blood. All cytokine values are indicated on the left Y axis except for IL-2, with values indicated on the right Y axis.

