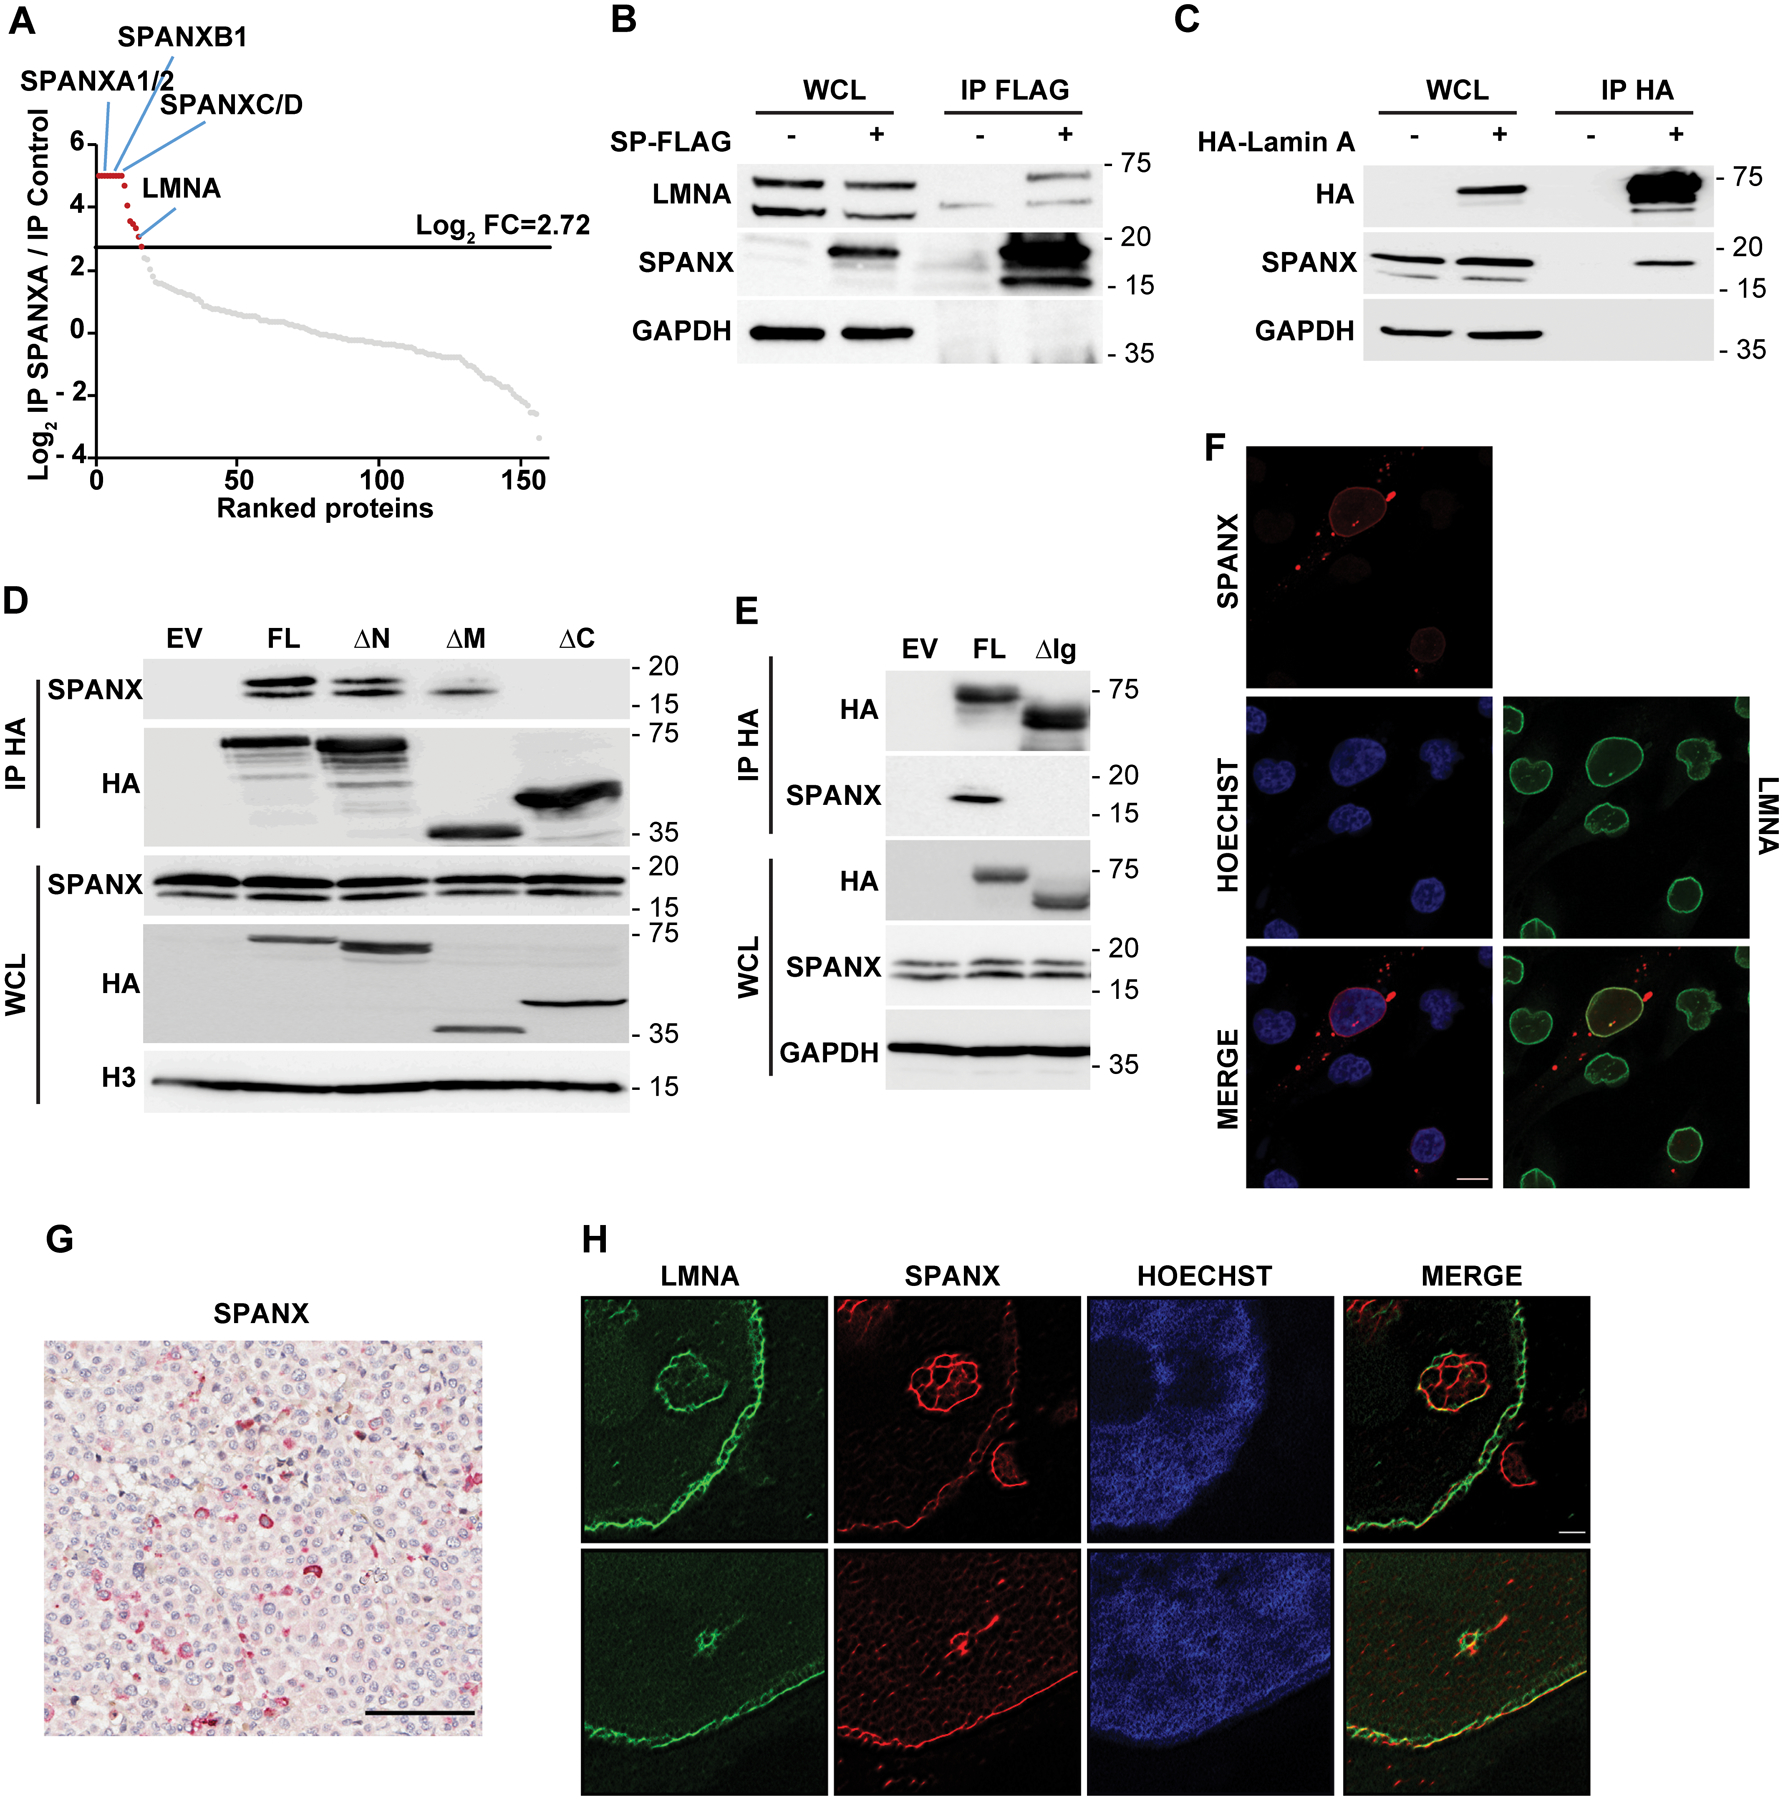
Figure 3: SPANX interacts with A type lamins.

A. A375 cells transduced with EV (pLVX) or vector expressing SPANXA-FLAG were treated for 3 days with doxycycline before seeding, lysis, immunoprecipitation (IP) using anti-FLAG beads. Precipitates were analyzed by nano LC-MS/MS. Graph shows log2 ratio of SPANXA-FLAG IP over IP control as measured by nano LC-MS/MS. Proteins are ranked from highest to lowest ratio. The log2 fold-change (FC) threshold of 2.72 was determined as described in Materials and Methods.
B. IP with anti-FLAG beads of A375 cells expressing FLAG-tagged SPANXA (SP) followed by immunoblot with indicated antibodies. WCL, whole cell lysate. C. IP with anti-HA beads of A375 cells expressing HA-tagged lamin A followed by immunoblot with indicated antibodies. D. IP of lamin A mutants (described in Fig S3D) followed by immunoblot for indicated proteins. WCL, whole cell lysate; FL, full length; ΔN, deletion of lamin A head; ΔM, deletion of lamin A central rod domain; ΔC, deletion of lamin A tail. E. IP of either FL lamin A or lamin A deleted of the Ig-like domain (ΔIg), as described in Fig S3E, followed by immunoblot for indicated proteins.
F. Immunofluorescence staining of endogenous SPANX and LMNA in A375 cells, as detected by confocal microscopy. Scale bar: 10μm. G. Immunohistochemical staining of SPANX in a tumor derived from a patient with melanoma. Sample is counterstained with hematoxylin. Scale bar: 100μm. H. Super-Resolution Radial Fluctuations (SRRF) microscopy analysis of endogenous SPANX and LMNA in A375 cells. Scale bar: 1μm.
